Settings for Bar Charts
Data Presentation
- value (string) - template from the dataset for data item to present graphically
- data / url (string) - the data source;
- label (string) - text label for each bar.
Learn how to draw chart scales in the dedicated chapter of the manual
Styling and Positioning
- barWidth (number) - width for each bar in pixels
- radius (boolean) - if true, sets curved bar tops
- gradient ( boolean, string, function) - gradient for each bar
- padding (object) - offset from the whole chart to the parent container {left: 50, top: 35, right: 20, bottom: 40}
- color (template, hex code, function) - color effects for the bars
- alpha (number between 0 and 1) - transparency of chart bars
- border (boolean) - if false, removes a black border of the bars. True by default.
Read more about Chart Coloring
Bar Chart Types
| Type | Vertical Bars | Horizontal Bars |
|---|---|---|
| Single data | bar | barH |
| Several data values | stackedBar | stackedBarH |
StackedBar and stackedBarH charts display data of several configuration objects (chart series), e.g. graphical representation of sales of three companies.
Bar Chart Series
Series can be defined for all bar charts. Series with bar and barH chart differ from those of stackedBar and stackedBarH. With the former bars are placed by each other in groups, which is greater for comparison. Moreover, the legend for them allows hiding and showing the dedicated chart by a single mouse click.
| Using series | 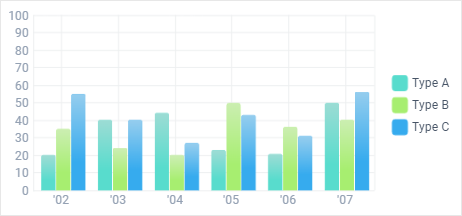 |
| 'stackedBar'/'stackedbarH' charts |
 |
Related sample: Bar Chart: Several Graphs in One Chart
The rules of series definition are described here.
Presets for Bar Chart
The library provides 3 presets for Bar charts. To set one of presets you should specify the preset property for the chart:
webix.ui({
    view: "chart",
    type: "bar",
    preset: "stick",
    ...
});
Related sample: Bar Chart: Style Presets
preset:"column" |
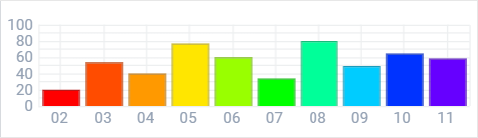 |
preset:"stick" |
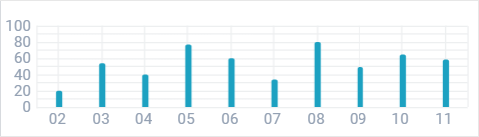 |
preset:"alpha" |
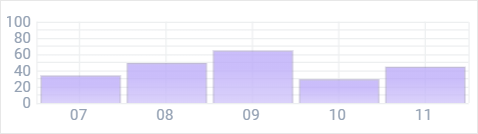 |