Color Effects
Chart elements can be colored in various ways, fixed colors being defined by the color parameter that takes a hex code. By default items are colored in a rainbow manner.
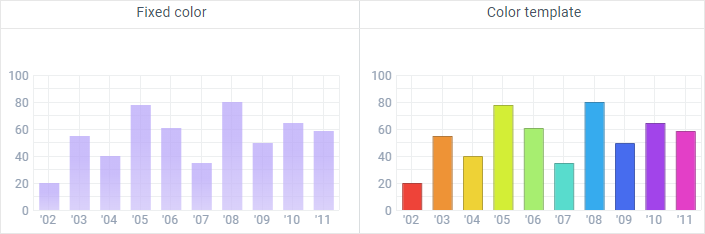
Custom color
Different colors for items can be defined right in a dataset.
var data = [
    { id:1, sales:20, year:"02", color: "#ee4339"}
];

webix.ui({
    view:"chart",
    type:"bar",
    value:"#sales#",
    color:"#color#"
});
Related sample: Chart: Basic Coloring
Color Template(Function)
If you want chart elements being colored according to a specific criterion, you should define colors with the help of a function.
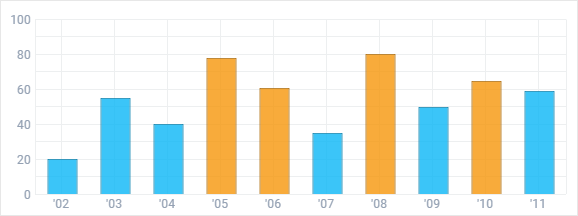
Here sales bars are distinguished by sales amount.
webix.ui({
    view:"chart",
    type:"bar",
    value:"#sales#",
    color:function(obj){
        if (obj.sales > 60)
            return "#f6960a";
        else
            return "#0ab6f6";
    }
})
Related sample: Chart: Specifying Color as a Function
Here is an example for a multilevel pie:
color: (item, index, levelIndex) => levelIndex ? null : palette[index]
In this example 0-level sectors get colors from the custom array with colors and child sectors get auto-calculated (lighter) colors.
Related sample: Pie Chart: Mutlilevel
Color Gradient
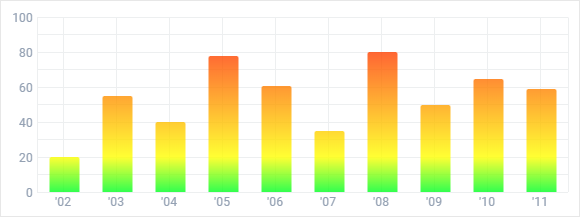
The gradient can be applied to bar and pie charts. It doesn't contain any information about the data, still it makes a chart look more stylish and attractive.
The gradient property can take the following values:
- boolean - true or false, the easiest way to enable/disable the gradient;
- string - "falling" and "rising" to the direction of the color shade; "light" and "3D" to add style effects for the gradient;
- function.
Colors for the gradient are defined with the help of the addColorStop() method that takes the gradient position (a number between 0.0 and 1.0) and the desired color codes as parameters.
gradient:function(gradient){
    gradient.addColorStop(1.0,"#FF0000");
    gradient.addColorStop(0.2,"#FFFF00");
    gradient.addColorStop(0.0,"#00FF22");
}
Related sample: Chart: Color Gradient
By default the gradient is disabled in the pie chart, so you need to enable it by assigning the true value to the gradient parameter.
Back to top