Setting Legend for a Chart
Chart legend explains data and color correspondence. Generally, to specify the chart legend you should use the legend property:
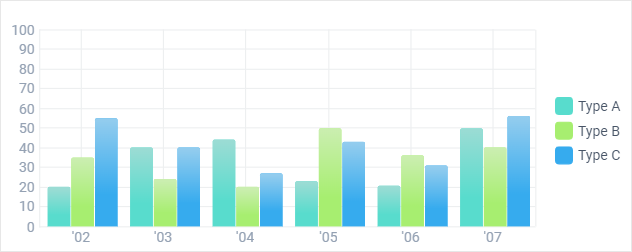
Specifying the legend for a chart
webix.ui({
    view:"chart",
    type:"bar",
    ...
    legend:{
        values:[
            {text:"Company A", color:"#58dccd"},
            {text:"Company B", color:"#a7ee70"},
            {text:"Company C", color:"#36abee"}
        ],
        align:"right",
        width:110,
        layout:"y"
    }
})
Related sample: Bar Chart: Several Graphs in One Chart
See the full list of legend parameters in API Reference.
Default Legend
Built-in means allow defining a default legend. For these needs, you should specify what element from the initial data source will be in the legend area. Default legend is great for pie and bar charts with multicolored bars and pie pieces.
Then, the legend takes a color value from the dataset:
JSON Data
[
    { sales:"20", month:"Jan", color: "#ee3639" },
    { sales:"30", month:"Fen", color: "#ee9e36" }
]
webix.ui({
    view:"chart",
    type:"pie",
    value:"#sales#",
    color:"#color#",
    legend:"#month#"
});
Related sample: Pie Chart: Basic and Custom Legend
See the full list of legend parameters in API Reference.
Custom Legend
- Legend customization includes marker dimensions and arrangement, their alignment towards the chart, colors and border as well as custom text for the markers.
- Custom legends are vital with chart series for different graphs need to be explained for users could read the charts.
- Legend markers defined for chart series are used to show and hide dedicated graphs (lines, areas, bars..) by clicking on their signs. Invisible charts can be shown back by clicking the gray 'inactive' marker sign.
Legend markers become "show-and-hide" buttons for all charts with series except for stacked charts (stackedArea, stackedBar, stackedBarH), because such charts presuppose series usage and don't imply visual comparison.
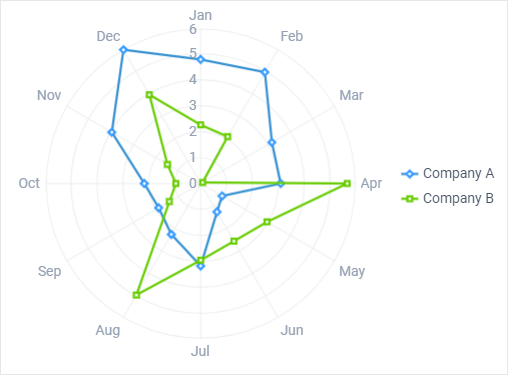
Custom legend
webix.ui({
    view:"chart",
    type:"radar",
    legend:{
        layout:"y",
        width: 110,
        align:"right",
        valign:"middle",
        marker:{
            width:15,
            radius:3
        },
        values:[
            {text:"company A",color:"#3399ff"},
            {text:"company B",color:"#66cc00"}]
    }
});
Related sample: Radar Chart: Lines
See the full list of legend parameters in API Reference.
Customizing Legend Markers
By default, legend markers are squares with rounded edges that feature 3-px border radius. To change this pattern, use the marker parameter of the into the legend property.
legend:{
    ...
    marker:{
        type:"round",
        width:15,
        radius:3
    },
}
Related sample: Radar Chart: Areas
'item' marker
Webix charts offer a possibility to set for a marker the same template that uses items of the related graph.
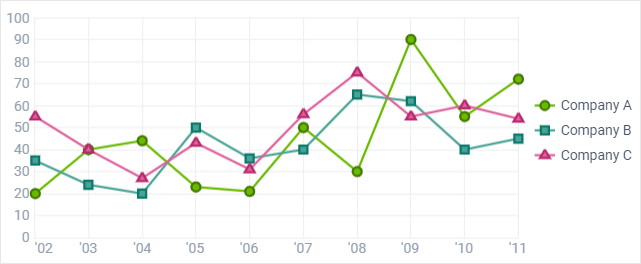
legend:{
    values:[{text:"Company A"},{text:"Company B"},{text:"Company C"}],
    ...
    marker:{
        type: "item",
        width: 18
    }
}
Related sample: Line Chart: Legend Markers
Setting different markers for different graphs
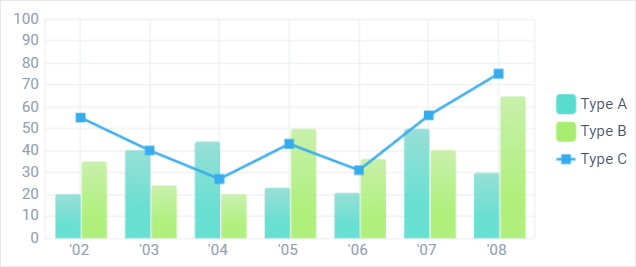
To set different markers for graphs you should:
- Specify legend items manually, through the values parameter (don't use template);
- Use markerType property to assign the desired marker type to a graph.
legend:{
    layout:"y",
    align:"right",
    valign:"middle",
    width:100,
    values:[
        {text:"Company A",color:"#00ccff"},                   //the default marker
        {text:"Company B",color:"#e9df40"},                   //the default marker
        {text:"Average",color:"#b25151",  markerType: "item"} //the redefined marker
    ]
}
Related sample: Bar Chart: Different Types in One Chart
Back to top