Setting Chart Scales
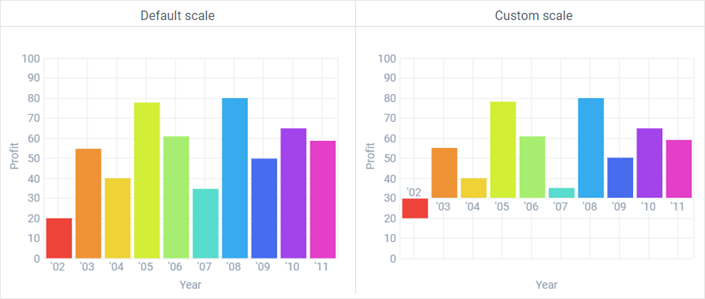
Scales are included into the following chart types:
- Line and spline charts
- Bar charts (optionally)
- Area charts
- Scatter charts
At the same time, radar chart has a specific scale type.
Scales consist of Y and X axes that are chart properties the values of which are objects containing several properties. Note that scales won't appear during chart initialization by default, if you don't include these properties into the chart constructor:
webix.ui({
    view:"chart",
    ...
    xAxis:{
        property:"value"},
    yAxis:{
        property:"value"}
})
- A vertical, yAxis of a chart is formed according to the values of data, the progress of which you want to show graphically. Naturally, the values are numeric. This data are specified by the chart's value property.
- A horizontal, xAxis displays progress of the data according to the specified criterion.
If needed, any axis can be omitted.
Let's suppose that we have a dataset presented below and we want to present sales progress during several years. Each data item contains sales amount and the year.
JSON data
[
    { id:1, sales:20, year:"02"},{ id:2, sales:55, year:"03"},
    { id:3, sales:40, year:"04"},{ id:4, sales:78, year:"05"},
    { id:5, sales:61, year:"06"},{ id:6, sales:35, year:"07"},
    { id:7, sales:80, year:"08"},{ id:8, sales:50, year:"09"},
    { id:9, sales:65, year:"10"},{ id:10, sales:59, year:"11"}
]
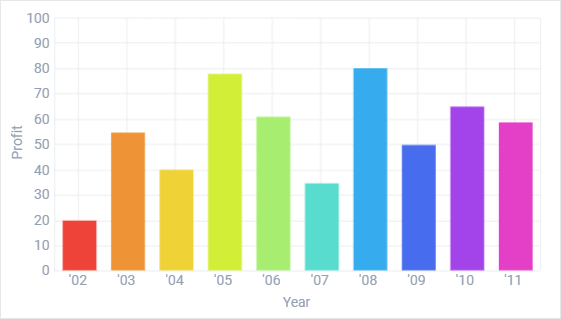
Default Scale
Y-axis Formation
If you set an empty yAxis property object (yAxis:{}), the dataset will be analyzed and the scale will be formed automatically. Here:
- the optimal step for units will be 10 as all the values are less than a hundred;
- the least unit value for the scale will be 20 as the least value in the dataset is 20 and the program will take the value nearest to 10;
- the largest unit value for the scale will be 80 since it's the greatest data value.
X-Axis Formation
Minimal compulsory API for the x-Axis includes
- template - data item from the dataset. Here it is #year#. Each value turns into a labeled unit on the line.
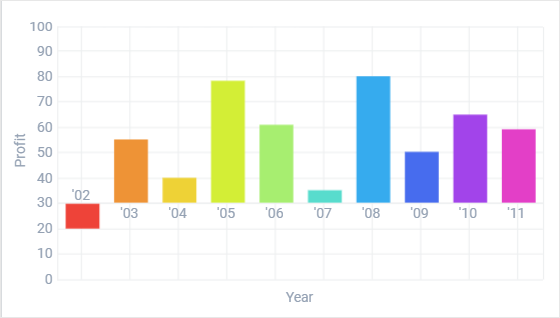
Custom Scale
Y-axis Formation
Y-axis object is constructed with the following properties:
- start (number) - start position for the axis, the value of the first unit;
- end (number) - max value for the axis, the last unit;
- step (number) - 'distance' to the next unit (not necessarily labeled with text);
- template - template for text label of the axis. Template function can define which numeric values to display. If not specified, text values are displayed depending on the 'step' parameter.
If you don't want to label each unit, you can set a function template to label only units multiplied by the specified number (here it's 20):
template:function(obj){return (obj%20?"":obj)}
X-axis Formation
- template(template) - template for text labels on the X axis;
- lines (boolean) - if false, the line for the axis isn't shown. By default this value is true.
- origin (number) - it's the property of the chart constructor, not the xAxis object. However, its value affects the position of x-Axis relative to the Y-axis. Data items with values lower than the stated one are displayed below the line.
There exists a possibility to create a fully custom axis for working with dates.
Offset
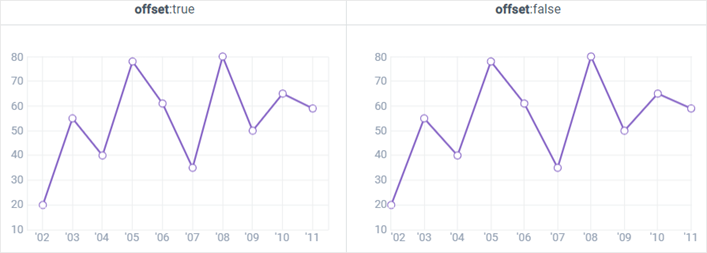
For line, scatter and area charts you can set the offset property which defines whether the first item of the scale will be drawn with the offset equal to the half of the scale's step (relative to the origin of the chart).
The default value for line and scatter charts is true. The default value for area charts is false.
webix.ui({
    view:"chart",
    type:"line",
    ...
    xAxis:{
        property:"value"},
    yAxis:{
        property:"value"},
    offset:false
})
Related sample: Line Chart: Axes
Logarithmic Scale
Webix charts are equipped with two types of scale:
- "linear" - used in all charts by default;
- "logarithmic" - enabled by the chart's scale property:
webix.ui({
    view:"chart",
    type:"bar",
    scale: "logarithmic",
    ...
});
Related sample: Chart: Logarithmic Scale
Titles for the Axes
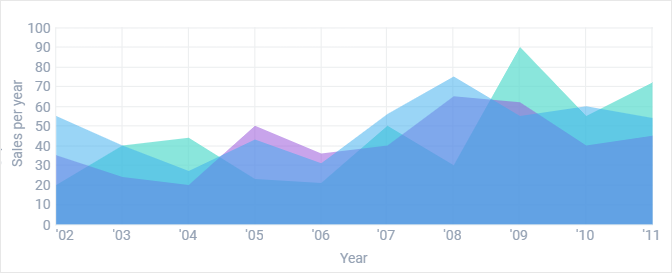
Titles are included into axes' objects:
webix.ui({
    view:"chart",
    ..config..,
    xAxis:{ ..
            title: "Year"},
    yAxis:{..
            title:"Sales per Year"}
})
In case of horizontal bar charts (type barH, stackedBarH) X and Y axes exchange their properties.