GeoChart
Since 5.0
API Reference
Overview
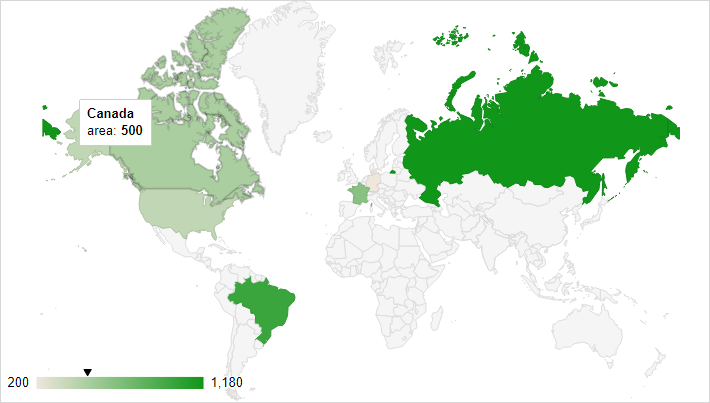
The GeoChart widget displays information about countries, regions or states according to the provided data with the help of Webix and Google Map API. The specified areas are highlighted with colors, labelled with texts or indicated with markers according to the chosen mode.
Initialization
To initialize Webix GeoChart on a page, use the following code:
webix.ui({
    view:"geochart",
    id:"map",
    // provide your own Google API key
    // https://developers.google.com/maps/documentation/javascript/get-api-key
    key:"AIzaSyAi0oVNVO-e603aUY8SILdD4v9bVBkmiTg",
    data:[
        {id:1, country:'Germany', area:200},
        {id:2, country:'United States', area:400},
        {id:3, country:'Brazil', area:1000},
        {id:4, country:'Canada', area:500},
        {id:5, country:'France', area:650},
        {id:6, country:'RU', area:1180}
    ]
});
Pay attention that before working with Webix GeoChart you need to get a personal Google API key.
Related sample: GeoChart: Basic
Main Properties
- key - your application's API key
The following properties define configuration of the GoogleMap widget:
- id - (string) defines the unique ID of the widget, optional;
- columns - (array) an array of columns for data rendering set by strings or objects;
- chart - (object) a set of chart settings. The settings correspond to Google GeoChart configuration options.
Here are the most popular of them:
- displayMode (string) - defines the mode of geochart rendering. There are four modes:
- 'auto' - (default) the mode is chosen based on the format of the data set.
- 'regions' - colors the regions.
- 'markers' - places markers on the regions.
- 'text' - labels the regions with text from the data set.
- region - (string) - the area to display on the geochart. Can have the following values:
- 'world' - (default) shows the entire world.
- a continent or a sub-continent, specified by its 3-digit code, e.g., '011' for Western Africa.
- a country, specified by its ISO 3166-1 alpha-2 code, e.g., 'AU' for Australia.
- a state in the United States, specified by its ISO 3166-2:US code, e.g., 'US-AL' for Alabama.
- resolution - the resolution of the chart borders. Choose one of the following values:
- 'countries' - (default) supported for all regions, except for US state regions.
- 'provinces' - supported only for country regions and US state regions.
- 'metros' - supported for the US country region and US state regions only.
- colorAxis - (object) an object that specifies a mapping between the color column values and colors or a gradient scale.
See the full list of options in the Google GeoCharts docs.
- displayMode (string) - defines the mode of geochart rendering. There are four modes:
- tooltip - (string, function) a string or function that specifies a custom tooltip for chart elements. It is defined according to the Tooltip API of Webix data widgets.
Getting the GoogleMap object
To get the map object, you can make use of the getMap method.
var mapObj = $$("map").getMap();
The method can take the waitMap parameter. If the parameter is passed, the method returns a promise which will be resolved when the map is rendered.
$$("map").getMap("waitMap").then(function(mapObj){
    // some code
});
Loading Data into GeoChart
GeoChart is a DataStore-based widget and you can work with it like with any other Webix data widget. You can use all common ways of data loading to load the data in supported data formats (JSON, XML, CSV, JSArray) into the chart.
Regardless of the data format, you should ensure that each data item contains the information about the related tile (country, region or state).
For example, you can set data inline with the help of the data parameter:
webix.ui({
    view:"geochart",
    key:"..",
    data:[
        {id:1, country:'Germany', area:200},
        {id:2, country:'United States', area:400},
        {id:3, country:'Brazil', area:700},
        {id:4, country:'Canada', area:500},
        {id:5, country:'France', area:200},
        {id:6, country:'Russia', area:880}
    ];
});
The data will be automatically converted into GeoChart-specific format and shown as regions, markers or texts depending on the chosen display mode.
Supported data formats
You can load data into GeoChart in the following formats:
- JSON (default)
- XML
<data>
    <item id="1" country="Germany" area="200"/>
    <item id="2" country="United States" area="400" />
    <item id="3" country="Brazil" area="700"/>
    <item id="4" country="Canada" area="500"/>
    <item id="5" country="France" area="200"/>
    <item id="6" country="Russia" area="880"/>
</data>
- JSArray
[
    ['Germany', 200],
    ['United States', 400],
    ['Brazil', 700],
    ['Canada', 500],
    ['France', 200],
    ['Russia', 880]
];
- CSV
Germany, 200
United States, 400
Brazil, 700
Canada, 500
France, 200
Russia, 880
See the details on the data formats supported by Webix.
Related sample: GeoChart: Data Formats
Customizing Columns
The columns setting defines the properties of a data item which will be displayed in the geochart in the desired order. The number of columns and their format are defined by the active display mode. Read the detailed specification on columns data format.
You can set the columns as an array of strings:
webix.ui({
    view:"geochart",
    key:"..",
    columns:["country", "area"],
    data:[
        {id:1, a:124, country:'Germany', area:200},
        {id:2, a:121, country:'United States', area:400}
    ]
});
In this case the column data type (number or string from above) will be detected automatically depending of the value of this property in the first data item.
Or, if needed, you can set the desired attributes like column label and data type explicitly:
webix.ui({
    view:"geochart",
    key:"..",
    columns:[
        { type:"string", label:"country"},
        { type:"number", label:"area"}
    ],
    data:[
        {id:1, a:124, country:'Germany', area:200},
        {id:2, a:121, country:'United States', area:400}
    ]
});
The columns can contain other properties. The format of columns is defined by the google.visualization.DataTable class.
Related sample: GeoChart: Custom columns
Manipulating Data Items
The GeoChart widget allows working with geochart data via Webix DataStore API, which means that you can load data into the geochart in any of the available ways as well as add, update, remove the items, etc.
var id = $$("map").add({country:"Brazil", area:900});
$$("map").updateItem(id, { area:1500});
$$("map").removeItem(id);
Related sample: GeoChart: Operations with Data
Handling Events
There are several events you can handle while working with geochart:
- onItemClick - allows catching a click on a data item (or, colored tile).
The event handler takes the id of the data item as a parameter.
webix.ui({
    view:"geochart",
    id:"map",
    key:"..",
    data:json_data,

    on:{
        onItemClick:function(id){
            webix.message("Data item clicked: "+this.getItem(id).country);
        }
    }
});
- onRegionClick - allows catching a click on a region (or, any tile).
The event handler takes the region object as a parameter.
webix.ui({
    view:"geochart",
    id:"map",
    data:json_data,
    key:"..",
    on:{
        onRegionClick:function(obj){
            webix.message("Region clicked: "+obj.region);
        }
    }
});
- onMapError - fires when a map has failed to load
$$("map").attachEvent("onMapError", function(id, message){
    // your code here
});
The event handler takes two parameters: the code of the error and the error message.
- onMapReady - fires when a chart is ready for external method calls
$$("map").attachEvent("onMapReady", function(){
    // your code here
});
Related sample: GeoChart: Events
Changing GeoChart Settings
Settings of the inner GeoChart, such as displayMode, region, resolution, colorAxis, etc. can be defined in the chart object definition:
{
    view:"geochart",
    id:"map",
    // provide your own Google API key
    // https://developers.google.com/maps/documentation/javascript/get-api-key
    key:"AIzaSyAi0oVNVO-e603aUY8SILdD4v9bVBkmiTg",
    data:data,
    chart:{
        displayMode:"regions",
        region:"150", // Europe
        colorAxis: {colors: ["#f2f28d", "#9370db"]}
    }
}
The full list of settings is available in the Google GeoCharts docs.
You can dynamically change them in one of the following ways:
- via the corresponding config option:
$$("map").config.chart.colorAxis = {colors: ["#e7711c", "#4374e0"]};
$$("map").config.chart.displayMode =  "markers",
$$("map").refresh();
- using Webix API for the most popular cases - setDisplayMode and setRegion methods:
$$("map").setDisplayMode("text");
$$("map").setRegion("IT");
Note that when changing the properties via config you should call the refresh method to apply changes.
Related sample: GeoChart: Modes
Using Custom Tooltip
You can set a custom tooltip for displaying the tiles' data via the related attribute of the geochart object. It is based on Webix Tooltip and uses the same syntax.
webix.ui({
    view:"geochart",
    id:"map",
    data:data,
    key:"..",
    columns:["country", "population"],
    tooltip:"Population: #population#<br>Area: #area#"
});
Related sample: GeoChart: Custom Tooltip
Note that this setting can't affect the displaying of a region name in the tooltip.
Selecting Countries and Regions
Since there's no genuine selection in Google GeoCharts, you can provide logic for tile highlighting on the base of the data while Webix API will help you.
For example, you can set the selected property for data items. Its value will be 1 for the "selected" items and 0 for "unselected" ones. On each item click the active item will be updated to selected:1, while all the others will be updated to selected:0.
In addition, you should restrict the Google Chart color axis to 0 and 1 values by setting its minValue and maxValue. Then, the axis colors will be correctly distributed between the "selected" item and "unselected" ones.
webix.ui({
    view:"geochart",
    id:"map",
    data:[
        { id:1, country:'Germany', selected:1 },
        { id:2, country:'United States', selected:0}
    ],
    key:"..",
    tooltip:"",
    chart:{
        legend:"none",
        colorAxis: { minValue: 0, maxValue: 1, colors: ["#f2f28d", "#9370db"]}
    },
    on:{
        onItemClick:function(id){
            this.data.each(function(obj){
                obj.selected = (obj.id == id)?1:0
            });
            this.refresh();
        }
    }
});
Note that items coloring depends on their data values. Here we just use the data and change it to mimic genuine selection.
Related sample: GeoChart: Selection
Back to top