Available only in PRO Edition
RangeChart
Since 3.2
The widget is available in the Webix Pro edition.
API Reference
Overview
RangeChart is a component that allows presenting data in a detailed way. It can be useful if you work with big amounts of data and need to display some particular data parts.
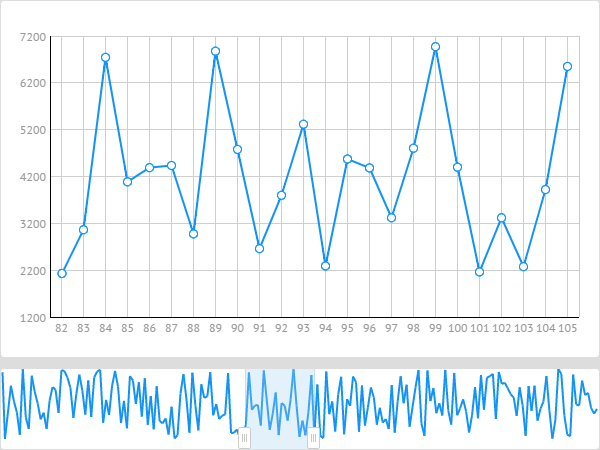
RangeChart is based on Chart component and inherits its API. RangeChart can be built upon any Webix chart that possesses a horizontal scale: line, spline, area and stackedArea, bar and stackedBar. However, it is not obligatory to initialize scales.
Visually, the related frame limits the amount of data for future processing. Frame values are always rounded to the next bigger value. It means that if you set a frame handler to some intermediate section between scale marks, it will be moved to that nearest point the value of which is bigger.
Related sample: Chart Frame :: Basic usage
Initializing Range Chart
To initialize a RangeChart, you need to define its configuration, like the one given below:
webix.ui({
    view:"rangechart",
    height: 80,
    id:"range",
    type:"line",
    value:"#sales#",
    frameId:"time",
    item: { radius :0 },
    range:{ start:30, end:50 },
    data: data
});
In general, all properties of a standard chart can be used to configure RangeChart, e.g:
- height - sets the height of the range chart
- id - the id of the range chart
- type - sets the type of the chart
- value - defines values for the vertical axis
- item - defines markers that present chart's data items
- data - specifies the dataset that will be loaded to the range chart
and two RangeChart-specific properties:
- frameId - specifies a property in the data item, that will be used for the frame (id by default)
- range - sets the data range that should be selected in the frame
In the range object you should specify either ids or indexes of the starting and the ending data items of the range.
What is more, you can set the id of the starting item and the index of the ending one and vice versa. The important thing is that there should always be one starting value and one ending value of the range. Thus, you can set the range as:
range:{ sindex:29, end:50 }
Setting Frame Range
The frame isn't set automatically and depends on data. So, it should be specified only after data are loaded to the RangeChart.
For example, you can set the frame range in the ready handler. The frame is specified by the setFrameRange method.
webix.ui({
  view: "rangechart",
  ...
  ready:function(){
    this.setFrameRange({
        start:30,
        end:40
    })};
});
The setFrameRange() method takes as parameters either ids or indexes of the starting and the ending data items of the range.
Notice that the priority of ids is higher than that of indexes. It means that in case difference between their values is great, the position of data range will be counted using the ids values.
In order to get the set frame range, you should use the getFrameRange method. It returns the object of the data range selected in the frame.
var range = rangechart.getFrameRange();
The configuration of the returned object looks like this:
{
    start: 30,
    sindex:29,
    end: 40,
    eindex:39
}
You can also get the data included into the frame range. For this purpose, make use of the getFrameData method.
It returns an array of data objects that are included into the range.
var data = rangechart.getFrameData();
Related sample: Chart Frame :: Basic usage
Working with RangeChart
RangeChart can be used to control data displayed within another data component, e.g. chart. For instance, each time when a range is changed in the RangeChart (master), changes are applied to the slave data component.
For example, let's consider an example with two charts. To begin with, you need to use the on property and specify the handler for the onAfterRangeChange event.
Inside of the handler function remove all data items from the slave chart using its clearAll() method. Finally, call the getFrameData() method of RangeChart to get the enclosed data and apply the parse() method to the slave chart to populate it with a new dataset.
var chart = {
    view:"chart",
    id:"dchart",
    type:"line",
    value:"#sales#",
    xAxis:{ template:"#time#" },
    yAxis:{},
    item:{
        borderColor: "#1293f8",
        color: "#ffffff"
    }
};

var range = {
    view:"rangechart",
    height: 80,
    id:"range",
    type:"line",
    value:"#sales#",
    frameId:"time",
    data:  data,
    on: {
        onAfterRangeChange:function(){
            $$("dchart").clearAll();
            $$("dchart").parse(this.getFrameData());
        }
    },
    ready:function(){
        this.setFrameRange({start:30, end:40});
    }
};