addSeries
adds an additional graph to the chart
void addSeries(object obj);
| obj | object | the graph configuration object |
Example
var barchart = webix.ui({
    view:"chart",
    type:"bar",
    value:"#sales#",
    color:"#58dccd"
    ...
});

barchart.addSeries({
    value:"#sales2#",
    color:"#36abee",
});
barchart.parse(multiple_dataset);
Details
The method is used to present multiple graphs on a chart. It's an analog to the series property.
Graphs are specified in a standard way.
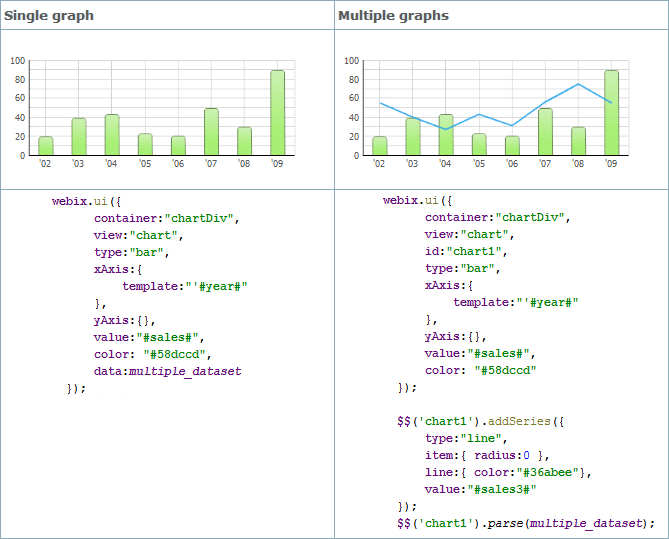
If you add to the chart graphs of the same type, you can omit the type attribute.
See also
API
Articles
If you have not checked yet, be sure to visit site of our main product Webix html5 framework and page of javascript charting product.