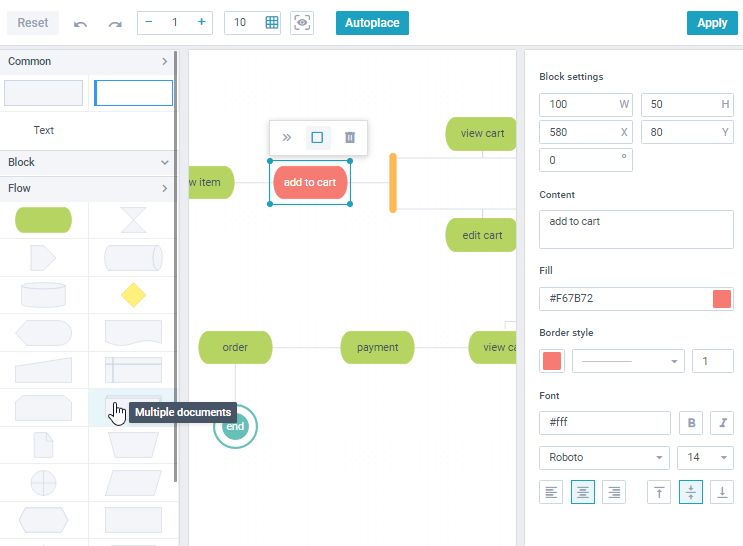
Diagram Editor
Since 8.4
The widget comes in one package with the Diagram component. The package requires Webix Pro edition and can be purchased as part of any license pack.
API Reference
Overview
Diagram Editor is a complementary tool designed for users to plot clean, performant and scalable charts via the user-friendly interface. The editor can also communicate with the Diagram itself making charting with the library even more flexible and smooth. Capabilities of the editor include:
- designing charts from scratch or predefined data sets
- drag-n-drop of blocks and links
- editing blocks and links via the dedicated form
- changing blocks parameters (incl. rotation angle, positioning and dimensions)
- dragscroll to expand working area.

Initializing
After installing Diagram, you can instantiate Diagram Editor in the usual way:
As a Webix view:
webix.ready(function() {
  // use custom scrolls, optional
  if (webix.env.mobile) webix.ui.fullScreen();
    webix.CustomScroll.init();

  webix.ui({
    view: "diagram-editor",
    data: base_data,
    links: base_links
  });
});
Related sample: Diagram Editor: Webix View Initialization
Or as an instance of Jet App class and render it in the document body (or in any other HTML container):
webix.ready(function() {
  webix.CustomScroll.init();

  const app = new diagram.App({
    data: base_data,
    links: base_links
  });

  app.render(document.body);
});
Related sample: Diagram Editor: JetApp Initialization
Configuring
Below you can find a set of properties specific for the Editor:
- gridStep (number) - defines a moving step for shapes being dragged (in pixels). 10 by default
- zoom (number) - defines the current zoom level. 1 by default
- save (function) - defines a function that will be called upon clicking the "Apply" button in the editor
- minItemWidth (number) - defines a minimum width for blocks when they are changed via form or drag-n-drop. 30 by default
- minItemHeight (number) - defines a minimum height for blocks when they are changed via form or drag-n-drop. 30 by default.
Editor basic configuration
webix.ui({
  view:"diagram-editor",
  data: base_data,
  links: base_links,
  zoom: 2,
  gridStep: 15,
});
Related sample: Diagram Editor: Setting Zoom and Grid Step
Passing Predefined Data to the Editor
To populate the editor with the predefined data use the dedicated data and links properties. The rules and formats are the same as for the Diagram Library.
webix.ui({
  view: "diagram-editor",
  data: [/* blocks */],
  links: [/* links */],
  shapes: [/* shapes */]
});
You can check the possible fields for each object in the blocks, links, and shapes data sets.
Reactive Properties
Reactive properties store global state of the app and let developers track their changes. Diagram Editor has several reactive properties:
- zoom (number) - current zoom level
- gridStep (number) - current step for shapes being dragged
- selected (object) - stores an ID of the element being selected currently (either a block/shape or link).
You can get the current state of the widget with the help of the getState() method:
webix.ui({
  view: "diagram-editor",
  id: "editor",
  data: base_data,
  links: base_links,
  gridStep: 20,
  zoom: 5,
});

const state = $$("editor").getState();

/*
  {
    gridStep: 20,
    zoom: 20,
    selected: {
      id: 100
    }
  }
*/
If a selected element is a link, the selected object has the link field:
{
  selected: {
    id: 25,
    link: true
  }
}
You can listen to the changes of the reactive properties and provide custom handlers for them via the $observe method of the state:
webix.ui({
  view:"diagram-editor",
  on: {
    onInit: function() {
      const state = this.getState();

      // creates message with the selected element
      state.$observe("zoom", zoom => webix.message("Current zoom is: " + zoom));
    },
  }
});
Related sample: Diagram Editor: Listening to State Changes
Getting and Setting Editor Data
Diagram and Diagram editor can be connected to each other by a set of API methods to retrieve and pass the required data.
From Diagram to Editor
To get the full Diagram data, call its serialize() method with the all parameter. To pass these data to the Editor, use its setValues() method passing the serialized data as a parameter.
const full_data = $$("diagram").serialize(true);
$$("editor").setValues(full_data);
The serialize() method with the passed all parameter returns the full data set including the following entities:
- data (array) - an array with block data
- links (array) - an array with link data
- shapes (array) - an array with all shapes currently used in this Diagram (default and custom ones)
- item (object) - a set of the default properties that are applied to Diagram blocks unless they have the corresponding settings of their own
- linkItem (object) - a set of the default properties that are applied to Diagram links unless they have the corresponding settings of their own.
// full_data
{
  data: [
    { id: "start", type: "circle", value: "start",  x: 0, y: 80 },
    // other blocks
  ],
  links: [
    { source: "start", target: "search", id: 132 },
    // other links
  ],
  shapes: [
    {
      backgroundColor: "#65C0B7", fontColor: "#fff",
      group: "block", id: "circle",
      lineColor: "#65C0B7", name: "Circle",
      svg: "svg_code"
    },
    // other shapes
  ],
  item: {
    height: 50, width: 100
  },
  linkItem: {
    arrowSize: 6, arrow: false,
    mode: "edges", backgroundColor: "magenta"
  },
}
From Editor to Diagram
To access the editor data, call the getValues() method on the editor instance. To load these values back to Diagram, use its parse() method:
const diagram = $$("diagram");
// clear old data
diagram.clearAll();
diagram.getLinks().clearAll();

//get and parse new data
const data = $$("editor").getValues();
diagram.parse(data);
If autoplacement was enabled for Diagram, make sure to switch it off to apply real block coordinates provided by the editor:
diagram.config.autoplace = false;
Related sample: Diagram Editor: Live Editing
Back to top