Chart
API Reference
Overview
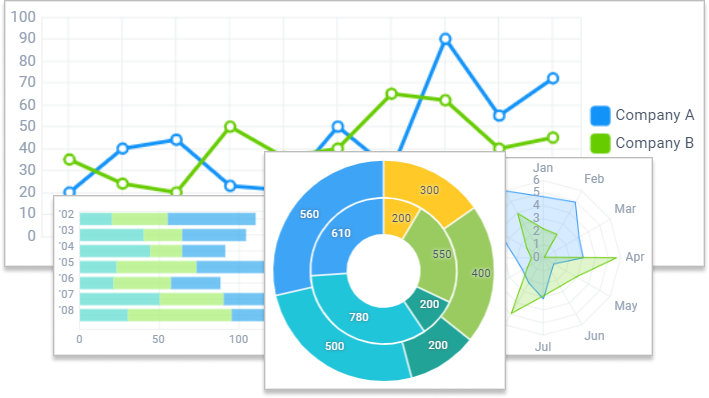
Chart is a UI-related component that inherits from view and helps present data in different graphic figures like colored columns, pie pieces or lines. Like all the data-presenting components it takes initial data in various formats.
In case you have huge volumes of data to work with and need to render a certain chunk of data in detail, the RangeChart component will come to the aid.
Initialization
The most important chart properties include type, template and value for data as well as criteria for data presenting (e.g. step of X axis in a bar chart). Specify the chart ID if you are going to work with it later.
Initialization of a Bar Chart
 webix.ui({
    view:"chart",
    type:"bar",
    value:"#sales#",
    color:"#f6960a",
    border:true,
    xAxis:{
        template:"'#year#"
    },
    yAxis:{
        start:0,
        end:100,
        step:10
    },
    data: dataset
});
Related sample: Chart: XML Dataset
To learn about all the chart properties, please refer to the corresponding chapter of the manual.
Working with Chart
- Chart Types
- Range Chart
- Dynamic Charts
- Setting Chart Scales
- Chart Series - Comparison Charts
- Setting Legend for a Chart
- Setting Chart Tooltip
- Data Grouping
- Operations with Chart Data
- Chart Coloring
- Components Export to PNG
- Data Components Export to Excel
Related Articles
- Data Object Operations
- Supported Data Types
- Redefinition of the Components
- Event Handling
- Operations with Data Items
- Chart CSS Image Map