Available only in PRO Edition
Gage
Since 4.1
The widget is available in the Webix Pro edition.
API Reference
Overview
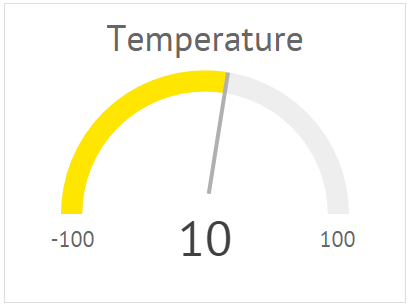
The Gage widget allows visualizing alteration of data values with the help of color representation of the displayed value.
Initialization
Basic configuration for Gage initialization looks like this:
webix.ui({
    view: "gage",
    id: "gage1",
    value: 60,
    minRange: 0,
    maxRange: 100,
    label: "Speed",
    placeholder: "km/hour",
    smoothFlow: false,
    scale:5,
    stroke:10
});
Main Properties
- value - (number) the initial value of the Gage widget. It should be set within the range of the minRange and maxRange parameters' values or equal to one of them.
- minRange - (number) the minimum range value of the Gage scale. 0 by default
- maxRange - (number) the maximum range value of the Gage scale. 100 by default
- label - (string) the text label of the control
- placeholder - (string) the text placeholder for the measurement unit of the Gage widget
- smoothFlow - (boolean) defines whether the change of values in the Gage will flow with smooth animation. True by default
- stroke (number) - defines the width of the gage scale
- scale (number) - defines the size of the gage scale
The full list of available configuration properties is given in the Gage API.
Setting Custom Colors
You can specify custom colors for the Gage widget, using the color property. There are two possible options:
- to set one fixed color for the control, set the color as a string value
webix.ui({
    view: "gage",
    minRange: 0,
    maxRange: 100,
    color:"green"
});
- to set different colors for particular ranges of values, specify a function that will define the logic of applying colors
var color = function(val){
    if (val < 40) return "green";
    if (val < 80) return "orange";
    return "red";
};

webix.ui({
    view: "gage",
    minRange: 0,
    maxRange: 100,
    color:color,
    label: "Pressure"
});
Related sample: Gage Chart - Custom Colors
Specificity of Loading Data
It is possible to load data into Gage from an external data source and get data from gage as well.
Loading data to Gage
You can choose one of two ways to load data into Gage (set the gage value):
- use Gage as a Form control and apply the load() method of Form, as follows:
webix.ui({
   view:"form",
   id:"form1",
   width: 500,
   elements:[
    { view:"gage", name:"value"}
   ]
});

$$("form1").load(url);
- use webix.ajax and then the setValue method of Gage
webix.ui({
    view:"gage",
    id: "gage2"
});

webix.ajax(url).then(function(data){
    // console.log(data.json());
    $$("gage2").setValue(data.json().value)
});
Getting Gage data
To get data from Gage (the set value), you can use the getValue method:
webix.ui({
    view:"gage",
    id: "gage3"
});

webix.ajax(url).then(function(data){
    $$("gage3").setValue(data.json().value)
    var gageValue = $$("gage3").getValue(data.json().value);
    // console.log("gage value is " + gageValue);
});
Adjusting Animation Speed
If you need to change the speed of animation, you can do this via CSS by addressing the following classes:
- .webix_gage_gradient_point_animated - it is the arrow pointer that shows changing data values. You should configure its property transition
.webix_gage_gradient_point_animated {
    transition: transform 1.3s linear;
}
- .webix_gage_animated - the colored line. You need to adjust its properties transition and animation.
.webix_gage_animated {
    animation: gage_dash 1.3s linear forwards;
    transition: stroke 1.3s linear, stroke-dasharray 1.3s linear;
}
@keyframes gage_dash {
  to {
    stroke-dashoffset: 0;
  }
}
Value Formatting
If you need to format gage values, you can use the "format" attribute. For example, you can minimize a value:
webix.ui({
  view:"gage",
  format: value => Math.round(value /1000),
  ...
});
Adding additional characters, like "%" or "$", is also possible:
webix.ui({
  view:"gage",
  format: v => v+"%",
  ...
});
Note that if gage values are too long, a small font size will be applied to the gage text. And if "webix_gage_small_font" class name is set as "css" attribute, a small font size will be applied regardless of values:
webix.ui({
  view:"gage",
  css: "webix_gage_small_font",
  ...
});
If you have not checked yet, be sure to visit site of our main product Webix web ui framework and page of javascript gage product.