Available only in PRO Edition
Bullet Graph
Since 4.3
The widget is available in the Webix Pro edition.
API Reference
Overview
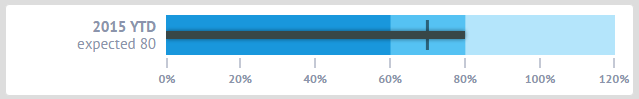
The Bullet Graph widget presents a more compact version of the Gage widget. It is intended for comparing a dynamically changed value displayed by a moving horizontal bar to a static value (target) set as a vertical line and relate both to qualitative ranges of performance (e.g. poor, satisfactory, and good).
Basic Initialization
Firstly, create a new HTML file and include the related Webix code files in it.
Required code files are:
- webix.css
- webix.js
A basic HTML page with the included code files
<!DOCTYPE html>
<html>
<head>
   <meta http-equiv="Content-Type" content="text/html; charset=utf-8" />
   <title>Bullet Graph</title>
   <script src="../codebase/webix.js" type="text/javascript" charset="utf-8"></script>
   <link rel="stylesheet" href="../codebase/webix.css" type="text/css" charset="utf-8">
</head>
<body>
    <script>        // here you will place your JavaScript code    </script>
</body>
</html>
Now you can move on to the initialization of the widget. A basic configuration for Bullet Graph initialization is given below:
webix.ui({
    view:"bullet",
    minRange:0,
    maxRange:120,
    value:40,
    bands:[
        { value:120, color:"#b4e5fb" },
        { value:80, color:"#55c2f3" },
        { value:60, color:"#1997dc" }
    ],
    label:"2015 YTD",
    placeholder:"expected #value#",
    marker:70,
    stroke:8,
    scale:{
        step:20,
        template:"#value#%"
    }
});
Main properties
- value - (number) the initial value of Bullet Graph. It should be set within the range of the minRange and maxRange parameters' values or equal to one of them.
- minRange - (number) the minimum range value of the Bullet Graph scale
- maxRange - (number) the maximum range value of the Bullet Graph scale
- color - (string|function) defines the color of the Bullet bar that shows the current value
- bands - (array) the set of value and color values for ranges of performance used in the widget. The default set is as follows:
    bands:[
        { value:100, color:"#5be5d6" },
        { value:80, color:"#fff07e" },
        { value:60, color:"#fd8b8c" }
    ]
- label (string) - the text label of the widget
- placeholder (string) - additional description for the widget's label or value
- marker (number|false) - defines the position of the marker of the target value, false by default
- stroke (number) - the width of the bullet graph bar. The default value is 8
- scale (object) - defines the scale configuration of Bullet Graph. The default value is scale:{step:10}
The full list of available configuration properties is given in the Bullet Graph API.
Adjusting Animation Speed
You can easily change the default animation speed which is 500 ms. For this purpose, you need to use the property flowTime:
webix.ui({
    view:"bullet",
    value:40,
    color:"green",
    flowTime:4000
});
Setting Dynamic Color
You can set a static color for the bar as shown in the above example. Alternatively, you can make the bar change color depending on the value. Define color as a function:
webix.ui({
    view:"bullet",
    value:40,
    stroke:16,
    color:(v) => {
        if (v < 30) return "red";
        if (v < 60) return "gold";
        return "green";
    }
});
The function receives one parameter - the current value of the Bullet graph.
Related sample: Bullet Graph - Color by value
Changing the Length of Scale Ticks
By default, the length of the scale ticks of the Bullet graph is 10px. You can change it by setting the value of the tickSize property.
webix.ui({
    view:"bullet",
    value:40,
    tickSize:4
})
Related sample: Bullet Graph - Ticks size
Back to topIf you have not checked yet, be sure to visit site of our main product Webix web development library and page of javascript bullet chart product.