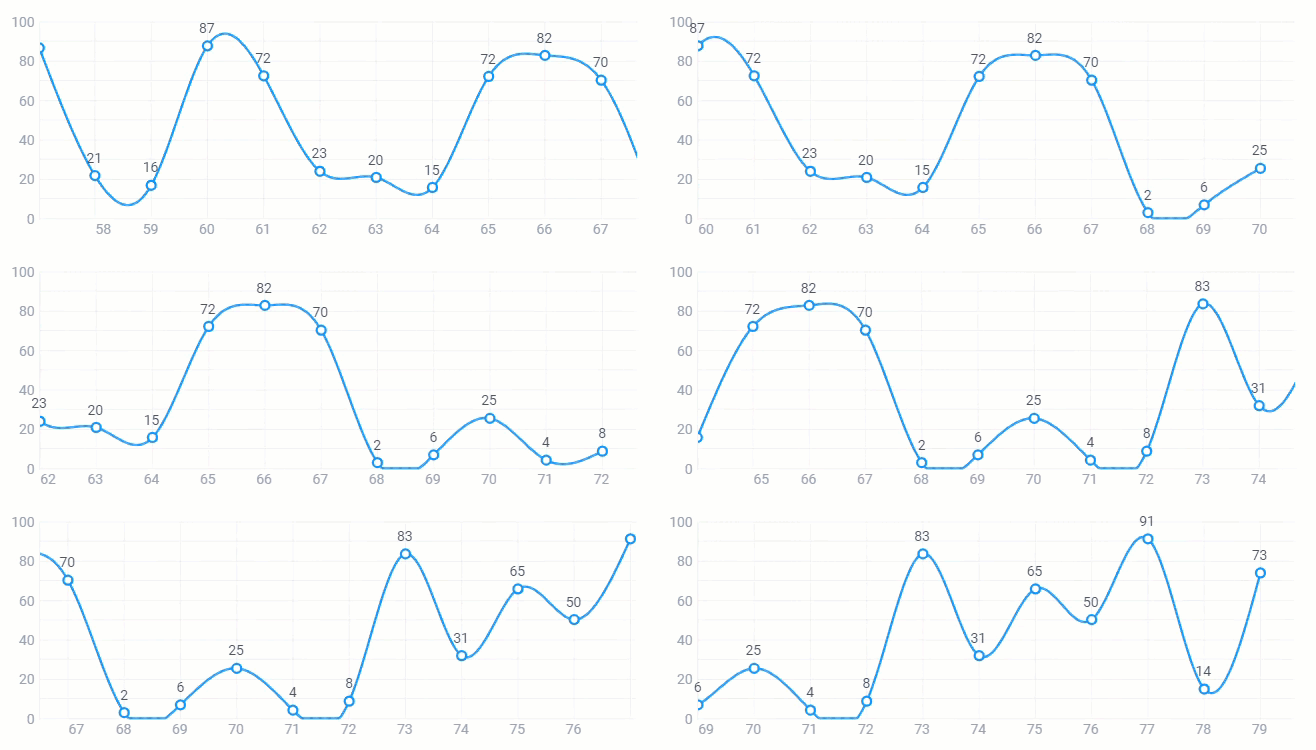
Dynamic Charts
Webix library provides the possibility to make your charts dynamic. Dynamic charts are being constantly updated and rendering of each item is animated. These charts will be helpful when you need to show the dynamics of data updating: fluctuation of temperature, variation of prices, etc.

Related sample: Dynamic Spline Chart
The following Chart types support the dynamic mode: Line and Spline Charts, Area and SplineArea Charts.
Initializing Dynamic Chart
A dynamic chart can be initialized as follows:
webix.ui({
    id: "chart",
    view: "chart",
    type: "line",
    value: "#yValue#",
    dynamic: true,
    cellWidth: 50,
    animateDuration: 300
});
There are three most important properties in the dynamic charts configuration:
- dynamic (boolean) - obligatory, enables the dynamic mode for a chart
- cellWidth (number) - specifies the width for a chart item's cell. The default value is 30.
- animateDuration (number) - sets the time of rendering the area/line of one chart item. The default value is 400.