Chart Tooltip
Tooltip is a graphical UI element that becomes visible when a user places a mouse pointer over the predefined area. It presents a popup that gives additional information on a user request.
Tooltip helps interpret chart values, giving precise numbers for bars as well as points in line, area, scatter and radar charts. Tooltip isn't normally used with pie charts as its values are written on pie pieces.
Chart tooltips are displayed in squares and include the value of an element you place a cursor over.
Useful tip: define eventRadius for a chart with a tooltip bigger than the radius of an item.
In essence, a tooltip works under Event Handling principles: it appears and disappears on "onMouseOver" and "onMouseOut" events respectively, both of them being attached to an item in the chart. Items are usually small and users need to be very precise with cursor pointing. Setting eventRadius bigger doesn't change anything in the chart appearance, but it simplifies tooltip triggering.
Tooltip Values
Tooltip values are defined on the base of data source values. While the chart represents a value graphically, tooltip gives literal explanation of this value.
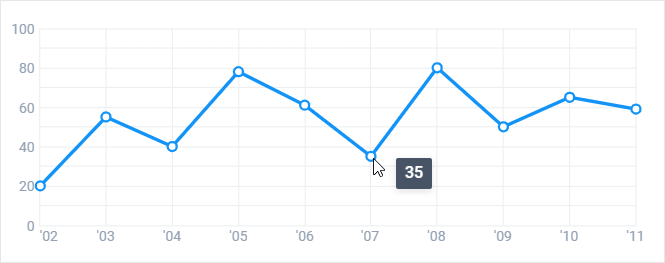
Let's take the left chart from above. It shows sales amounts per each year. Years are displayed over a horizontal scale, while sales amount defines the height of the point on the vertical scale.
JSON Data
var dataset = [
    { id:1, sales:20, year:"02"},
    { id:2, sales:55, year:"03"}
];
Tooltip here takes the #sales# value and shows the exact sales amount, as you place a cursor over the point.
webix.ui({
    view:"chart",
    type:"line",
    value:"#sales#", // settings for yAxis
    xAxis:{
        template:"'#year#"
    },              // settings for xAxis
    tooltip:{
        template:"#sales#" // tooltip
    }
    eventRadius: 10
});
Related sample: Line Chart: Styling
Templates may include several properties of one and the same data object.
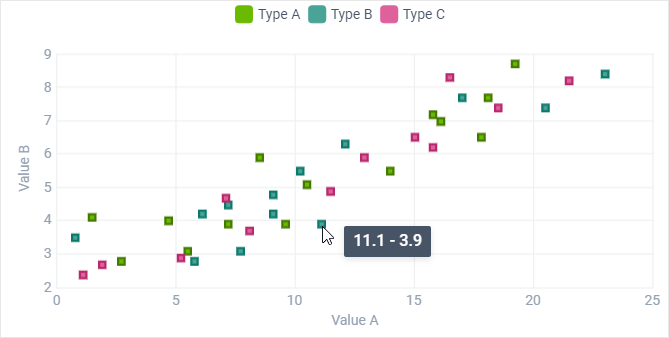
If you want to see a "year - sales" tooltip for the chart above, change the tooltip template and include #year# to it:
tooltip:{
    template:"#year# - #sales#"
}
Such tooltips are especially convenient for Scatter charts where points aren't connected by lines and it's difficult to read the exact value:
Related sample: Scatter Chart: Templates
Back to top