Chart Types
Here we speak about various Webix chart types that you have at your disposal. Basically, you should set the type property of the chart constructor to the necessary value to switch to the corresponding chart type.
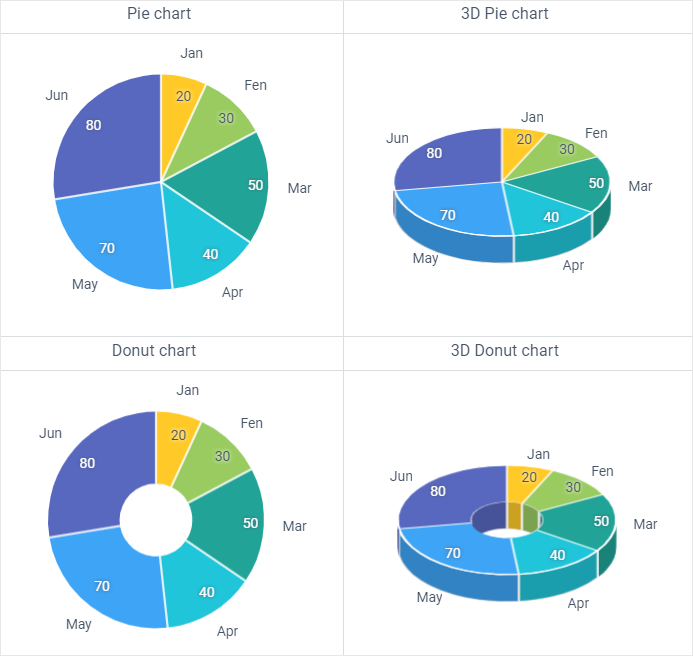
Pie, 3D Pie Chart, Donut and 3D Donut Charts
Initialization
webix.ui({
    view: "chart",
    type:"pie", //or "pie3D", "donut", "donut3D"
    ...
})
If you want to make a multilevel Pie chart, use the multilevel property.
Related sample: Pie Chart: Basic Initialization
Line and Spline Charts
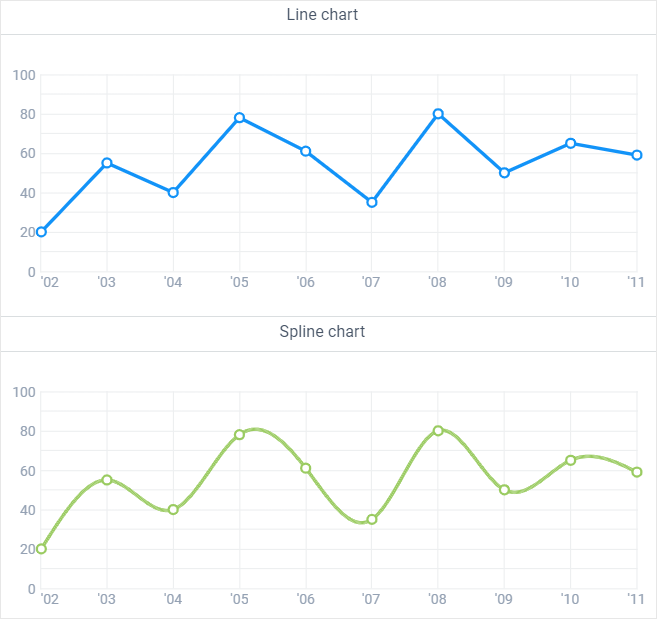
Line chart features a broken line to join the points while a spline chart has a curved one.
Initialization
webix.ui({
    view:"chart",
    type:"line" //or "spline"
    ...
})
Related sample: Line Chart: Basic Initialization
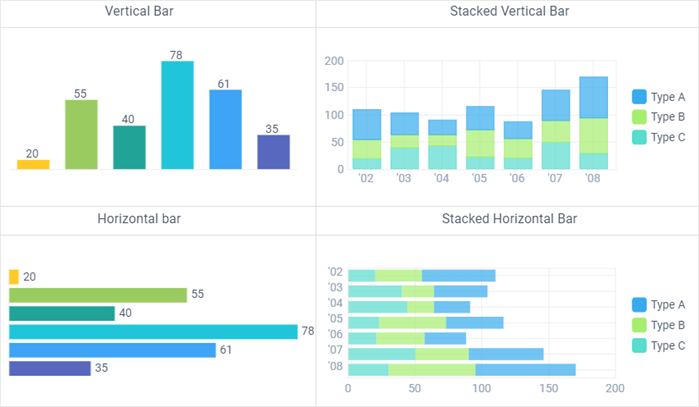
Bar, BarH, StackedBar and StackedBarH Charts
Initialization
webix.ui({
    view:"chart",
    type:"bar" //or "barH", "stackedBar", "stackedBarH"
    ...
})
Related sample: Bar Chart: Basic Initialization
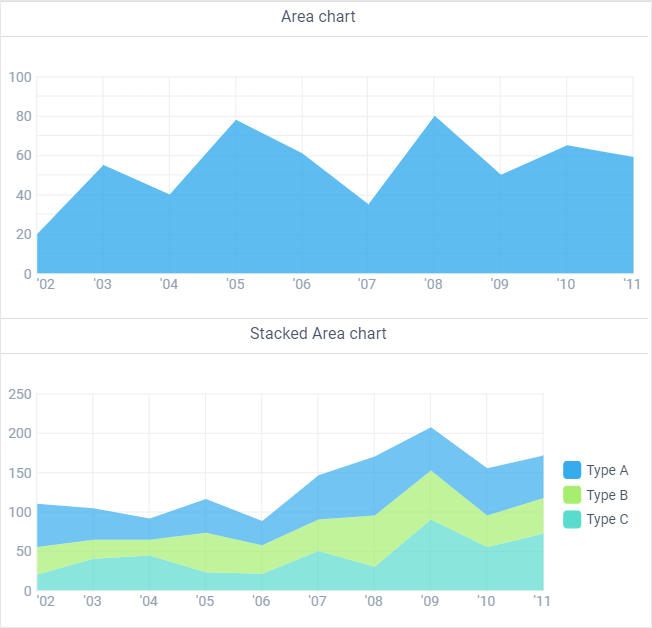
Area and stackedArea Charts
Initialization
webix.ui({
    view:"chart",
    type:"area", //or stackedArea
    ...
})
Related sample: Area Chart: Basic Initialization
SplineArea Chart
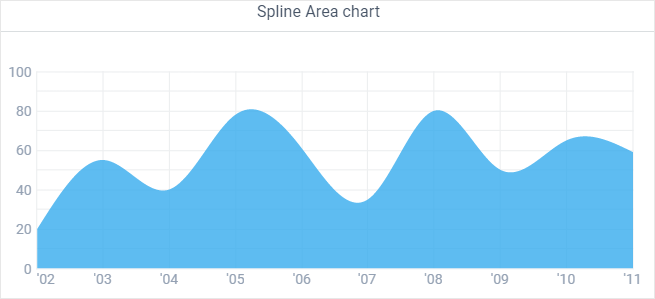
Initialization
webix.ui({
    view:"chart",
    type:"splineArea",
    ...
})
Radar Charts
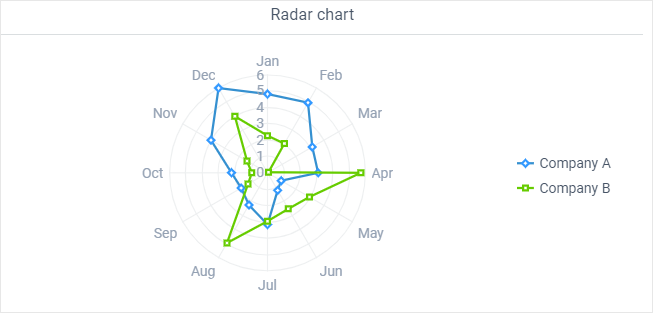
Initialization
webix.ui({
    view:"chart",
    type:"radar",
    ...
})
Related sample: Radar Chart: Points
Scatter Charts
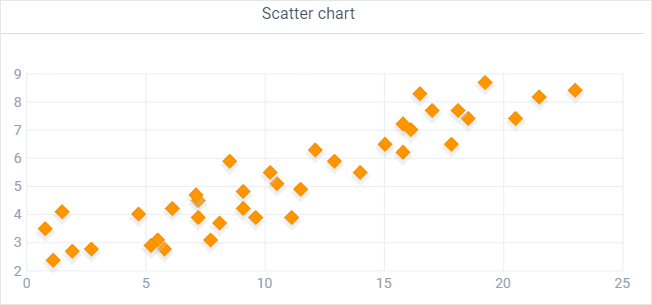
Initialization
webix.ui({
    view:"chart",
    type:"scatter",
    ...
})
Related sample: Scatter Chart: Basic Initialization
Back to top