Settings for Radar Chart
Custom Initialization
Data Presentation
- value (string) - an item template from the dataset;
- data / url (string) - the data source;
- item (object) - an object property that contains settings for each point in the graph:
- alpha (number) - (number from 0 to 1) the marker opacity (by default, 1)
- borderColor (string,function) - the color of the point border;
- borderWidth (number) - the width of the border (for square points);
- color (string, function) - the color of the points as a hex code or a function;
- eventRadius (number) - the radius of the virtual circle the events of which will fire for items within;
- shadow (boolean) - if true, adds a shadow to a point. False by default;
- radius (number) - the radius of the point;
- type - (string) - the shape of a marker ( by default, 'r'). The predefined values are:
- 's' - square;
- 't' - triangle;
- 'd' - diamond;
- 'r' - round;
- line - (object) an object property that contains setting for the line;
- color (string) - the color of the outline;
- width (number) - the width of the outline;
- fill (string) - the color to fill the area limited by the outline;
- disableLines (boolean) - enable/disable the line that joins points, false by default;
- disableItems (boolean) - if true, forbids items rendering on the chart, false by default.
Scales
- xAxis - a label for each radar line that goes from the center to the outside:
- template (string) - text labels for lines;
- lineColor (string) - the color of radar lines;
- yAxis - the settings for the radar map and inner lines (circles):
- lineShape (string) - the shape of the outer border of the radar area. 'arc' helps make a circle;
- background (string) - the background color of the radar area;
- lines (boolean) - if false, inner circles of the radar area aren't shown.
Radar Charts Presets
The library provides 3 presets for Radar charts. To set one of presets you should specify the preset property for the chart:
webix.ui({
    view: "chart",
    type: "radar",
    preset: "line"
});
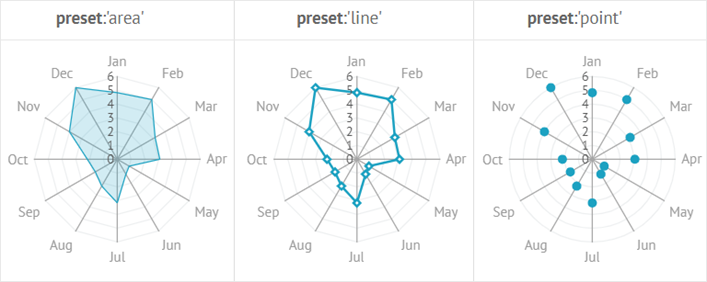
Related sample: Radar Chart: Style Presets
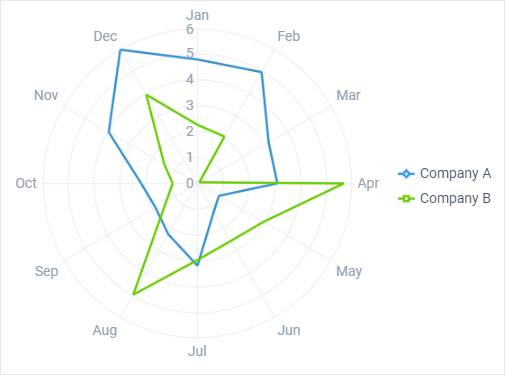
Radar Chart Series
Chart series is an array of settings for each graph to display different data in comparison.
In case of chart series, legend markers become buttons to show and hide dedicated charts.
Related sample: Radar Chart: Lines
Read more about Chart Series.
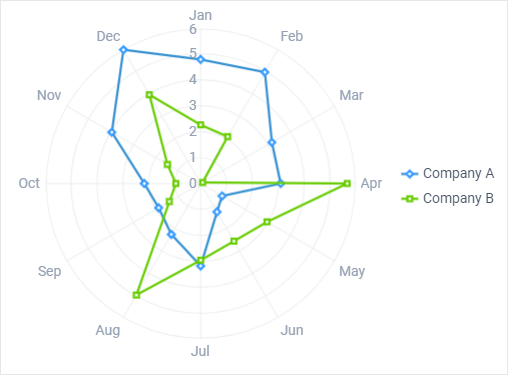
Removing Points
If you want to get rid of points while rendering a "line" Radar chart, make use of the disableItems property:
webix.ui({
    view:"chart",
    type:"radar",
    value:"#companyA#",
    preset:"line",
    xAxis:{
        template:"#month#",
        lineColor:"#A5A5A5"
    },
    disableItems:true,        data:companies
})