Settings for Line Charts
Here various properties of line charts are listed. The properties construct the chart object. Some of the properties contain an object as value. Data-presenting properties are compulsory while a number of styling options can be omitted or replaced.
Data Presentation
- value (string) - the data item chosen for graphical representation; as a rule, its values are taken for text labels of the Y axis
- data / url (string) - data source for the component
- label (string) - text labels for each point on the line.
Setting titles for each axis:
Here you should add title parameter for xAxis and yAxis constructor:
xAxis:{
    ...
    title:"Some Text_1"
},
yAxis:{
    ...
    title:"Some Text_2"
}
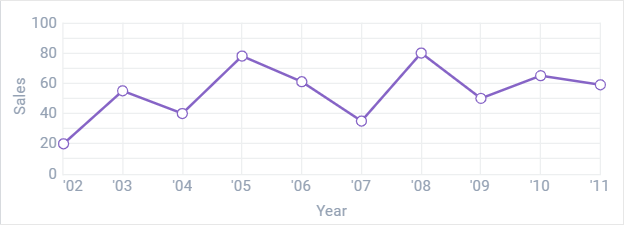
Related sample: Line Chart: Axes
Learn how to set scales for the chart in the corresponding chapter of the manual.
Chart Series. Several Graphs in One Chart
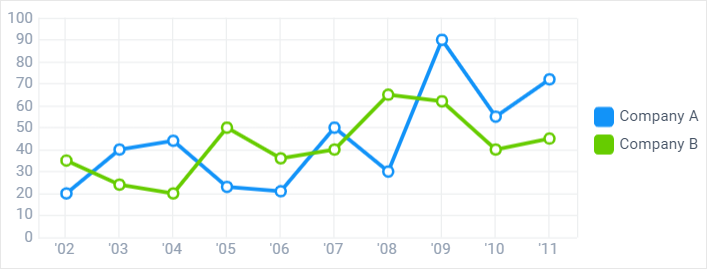
Related sample: Line Chart: Several Graphs in One Chart
Read more about Chart Series.
Styling and Positioning
- item (object) - a point on the line, a stop for each value. It includes:
- alpha (number) - (number from 0 to 1) the marker opacity (by default, 1)
- borderColor (string,function) - the color of the point border
- borderWidth (number) - the width of the border (for square points)
- color (string, function) - the color of the points as a hex code or a function
- eventRadius (number) - the radius of the virtual circle the events of which will fire for items within
- shadow (boolean) - if true, adds a shadow to a point. False by default
- radius (number) - the radius of the point
- type - (string) - the shape of a marker ( by default, 'r'). The predefined values are:
- 's' - square
- 't' - triangle
- 'd' - diamond
- 'r' - round.
- line - a broken or curved (in case of a spline chart) line:
- color (string) - the color of the line as a hex code
- width (number) - the width of the line
- shadow (boolean) - a shadow for the line (optional).
- offset (number) - the offset of the first item in a chart, the initial numeric value.
Getting rid of points on the line
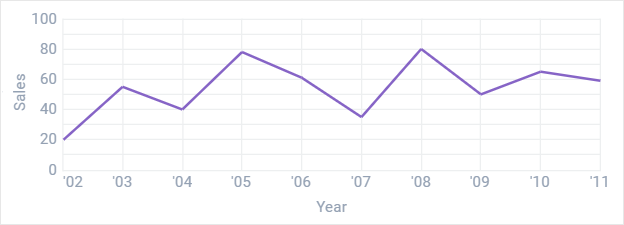
item:{radius:0}
Making square points for the line
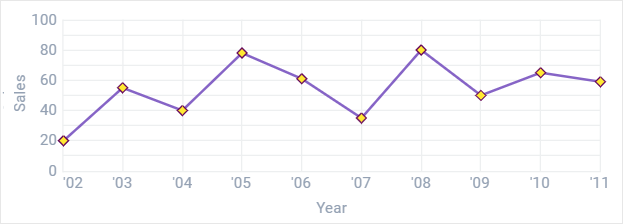
item:{
       borderColor:"#b64040",
       color: "#b64040",
       type:"d",
       radius:3,
       borderWidth:1 //here you make it square
}
Related sample: Line Chart: Styling
Style Presets
There are three style presets for the Chart component
- plot - a blue line with white points
- diamond - an orange line with wine red square points
- square - an emerald line with hollow square points
- round - a blue line with semi-transparent points
- simple - a light green line with dark green points.
All of them are set with the help of preset property.
Related sample: Line Chart: Style Presets
Back to top