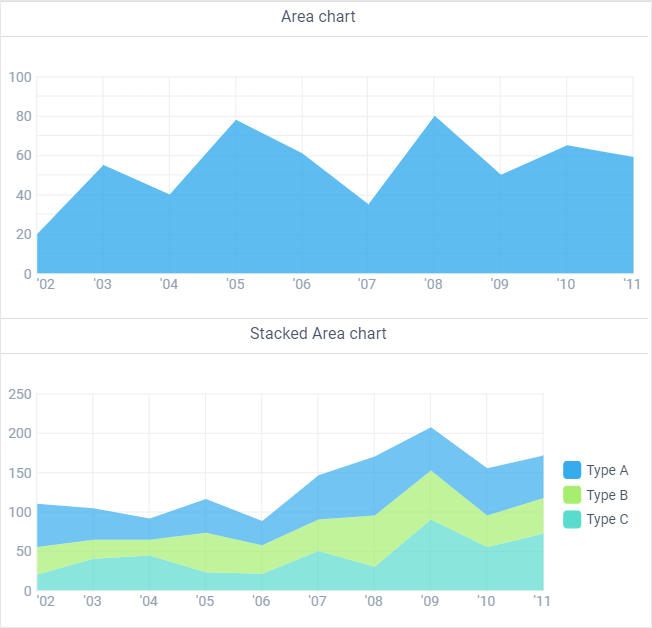
Settings for Area Charts
- value (template) - item template from the dataset;
- data / url - the data source;
- color (hex code, template) - color for the colored area;
- alpha (a number between 0 and 1) - the transparency of the colored area.
Area chart can be supplied with common functionality that is true for all chart types:
- Scales, horizontal and vertical lines with values. See Rules of Scale Building for details.
- Tooltips, popups that show the exact value of the key points.
- Legend, colored markers that explain what each chart within the scales mean.
Chart Series
Both Area and StackedArea charts support presenting graphs for several objects (series).
Series for chart is an array of objects with settings for each graph. Details here.

Related sample: Area Chart: Several Graphs in One Chart
Related sample: Stacked Area Chart
Back to top