How-tos
You can read about general customization rules in the corresponding article.
Custom Palette for Chart
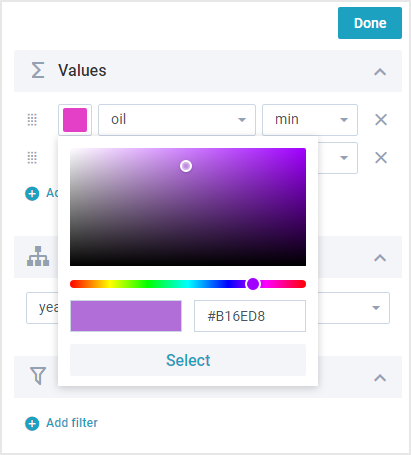
In case the built-in palette does not meet your project requirements, you can define a custom one. Create a custom class and inherit it from the default pivot.views["config/properties/values"]. Its ItemConfig() method is the one to redefine.
In this sample we will use ColorSelector as a custom palette:
class CustomValuesProperty extends pivot.views["config/properties/values"] {
  ItemConfig(val, i) {
    const config = super.ItemConfig(val, i);
    config[1].suggest = {
      padding: 0,
      type: "colorselect",
      body: {
        button: true,
      },
    };
    return config;
  }
}
Do not forget to override the default view:
webix.ui({
  view: "pivot",
  structure: {
    rows: ["form", "name"],
    columns: ["year"],
    values: [{ name: "oil", operation: ["min", "sum"] }],
  },
  override: new Map([
    [pivot.views["config/properties/values"], CustomValuesProperty],   ]),
});
Related sample: Pivot: Custom Palette for Chart Mode
Providing Unlimited Number of Rows
By default Pivot can process 10.000 rows of data. You can extend this to any number your project requires. To provide unlimited number of rows create a custom class and inherit it from the default pivot.services.LocalData. Redefine its getLimits() method as follows:
class MyData extends pivot.services.LocalData {
  getLimits() {
    return { rows: Infinity, columns: Infinity, raws: Infinity };
  }
}
Do not forget to override the default service:
webix.ui({
  view: "pivot",
  structure: {
    rows: ["form", "name"],
    columns: ["year"],
    values: [{ name: "oil", operation: ["min", "sum"] }],
  },
  override: new Map([[pivot.services.LocalData, MyData]]), });
Related sample: Pivot: Data Limits
Combining Different Chart Types
Sometimes it is necessary to display two charts at the same time. With some customisation you can achieve this.
As always, we will create some custom classes that inherit from the default ones, redefine a few methods, and override the default services.
To start, let's create a custom MyValues class and inherit it from pivot.views["config/properties/values"]. Here we will redefine the init() method to keep track of mode and chart type changes:
class MyValues extends pivot.views["config/properties/values"] {
  init() {
    super.init();

    this.on(this.State.$changes, "mode", () => this.ToggleTypes());
    this.on(this.State.$changes, "chart", () => this.ToggleTypes());
  }
  ...
}
If the chart type is "mixed," controls (we'll configure them in the next step) for selecting the type for each chart are displayed. This can be achieved using the redefined ToggleTypes() method:
ToggleTypes() {
    const mode = this.State.mode;
    const type = this.State.chart.type;

    const layout = this.$$("forms");
    const forms = layout.getChildViews();

    for (let i = 0; i < forms.length; i++) {
      const input = forms[i].getChildViews()[0].elements.type;
      if (mode == "chart" && type == "mixed") input.show();
      else input.hide();
    }
}
The last redefined method of our newly created class, ItemConfig(), adds two richselect controls. They contain type options for the charts we want to display at the same time:
  ItemConfig(val, i) {
    const config = super.ItemConfig(val, i);
    const type = this.State.chart.type;

    config.splice(2, 0, {
      view: "richselect",
      name: "type",
      width: 120,
      hidden: this.State.mode != "chart" || type != "mixed",
      value: val && val.type ? val.type : "bar",
      options: {
        css: "webix_pivot_suggest",
        data: [
          { id: "bar", value: "Bar" },
          { id: "line", value: "Line" },
          { id: "area", value: "Area" },
          { id: "spline", value: "Spline" },
          { id: "splineArea", value: "Spline Area" },
        ],
      },
    });

    return config;
  }
Then we'll add the MyMain class and inherit it from pivot.views["main"]. Here we set the column width by redefining the config() method:
class MyMain extends pivot.views["main"] {
  config() {
    const config = super.config();
    if (!this.Compact) config.rows[1].cols[1].width = 600;
    return config;
  }
}
The next step is to create a MyChart class, which inherits from pivot.views["chart"]. We are going to redefine the config() method so that if the type of the chart is "mixed", it will be configured as a bar chart type.
class MyChart extends pivot.views["chart"] {
  config() {
    const config = super.config();
    if (config.type == "mixed") config.type = "bar";
    return config;
  }
  ...
}
Redefined SetSeries() method will create chart series:
SetSeries(values) {
    for (let i = 0; i < values.length; i++)
      this.$$("data").addSeries(
        this.GetSeriesConfig(
          values[i],
          i,
          this.State.chart.type == "mixed"
          ? this.State.structure.values[i].type || "bar"
          : null
        )
      );
  }
The final custom class we need to create is MyChartProperties, which inherits from pivot.views["config/properties/chart"]. The redefined config() method adds a new "Mixed" chart option to the dropdown list:
class MyChartProperties extends pivot.views["config/properties/chart"] {
  config() {
    const config = super.config();
    const type = config.elements[0];
    type.label = "Chart type";
    type.options.data.push({ id: "mixed", value: "Mixed" });
    return config;
  }
  ...
}
To finish with MyChartProperties, redefine the HandleVisibility() method to add some chart settings for our new type:
  HandleVisibility() {
    const form = this.getRoot();
    const type = form.getValues().type;
    if (type == "mixed") {
      form.showBatch("scale");
      form.showBatch("axis", true);
      return;
    }
    super.HandleVisibility();
  }
At the end, we override the default services:
webix.ui({
  view: "pivot",
  ...
  override: new Map([
    [pivot.views["config/properties/values"], MyValues],
    [pivot.views["config/properties/chart"], MyChartProperties],
    [pivot.views["main"], MyMain],
    [pivot.views["chart"], MyChart],
  ]),
});
Related sample: Pivot: Combine Different Chart Types
Back to top