Intermediate
Chart Integration
How to Include
JS files for these components are not included in the library package and should be taken:
- either from Github https://github.com/webix-hub/components
- or included from CDN as:
<script src="https://cdn.webix.com/components/edge/ckeditor/ckeditor.js"></script>Except for the built-in charts, Webix offers a possibility to integrate third-party charts from the following libraries:
- D3 JS Library
- JustGage Javascript Plugin
- Raphael JavaScript Library
- SigmaJS Library
- FusionCharts Library
- Highcharts Library
Note in the package samples third-party scripts are included in another way, but you should follow the linking pattern described further and shown in the snippets attached.
Setting the Path to the Component
You can set the path to the sources of the necessary chart on CDN. Actually, there are three ways to do that:
- via the cdn property in the view configuration. This way allows setting the path to the particular version of the necessary library or to the local CDN
- not setting any paths at all. In this case, either the official CDN of the component or the global cdnjs (if the source of the component is available there) will be used
- by directly including all the source files of the component on a page. In this case, you should set the cdn property to false to avoid possible collisions with the component version included by default.
Chart Configuration
Each third-party chart has its API. If you want to use it to configure a chart, get the chart object with the help of the getChart() method:
D3 API configuration has its peculiarities, see the details below.
const chart = $$("gage1").getChart();
The method has the optional waitChart parameter. If it is set tu true, the method returns a promise, which allows you to wait till the chart is ready and then use its properties. For example:
$$("gage1").getChart(true).then(function(chart){
    //  chart is the chart object
});
You can find the links to the API of each chart in the sections below.
D3 Charts
D3 charts helps to manipulate documents based on data and offers powerful visualization tools and a data-driven approach to DOM manipulation.
One of its implementations, Bubble chart, displays data in circles that pack hundreds of values into a small space.
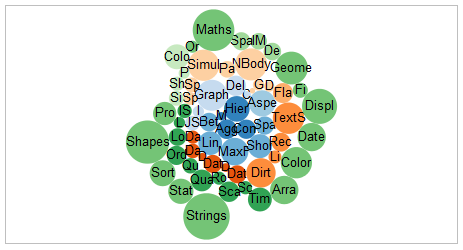
Related sample: D3 Bubble Chart
Component Initialization
First, you should include the D3 JS file from the package into your document (in addition to the Webix files):
<script type="text/javascript" src="./d3.js"></script>Next, initialize the view:
webix.ui({
    view:"d3-chart",
    url:"...",
    ready:function(){/*...*/};
});
- url - specifies data source for the chart (data file or script)
- ready - function that is executed when the component is fully loaded. It contains the code of the needed chart.
Using D3 API
To receive access to the general selection object of a D3 element, use the getSelection() method:
$$("myD3").getSelection(true).then(function(selection){
    //  selection is the selection object
});
The method has one parameter - wait. If it is true, the method returns a promise of the selection object, otherwise (when the parameter is not passed) the method returns the selection object at once.
JustGage Gauges
JustGage JS is a handy JavaScript plugin for generating and animating nice gauges. It is based on the Raphaël library for vector drawing.
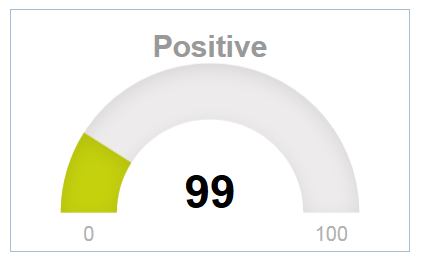
Related sample: JustGage Chart
Component Initialization
First, you should include the JustGage JS file from the package into your document in addition to the Webix files:
<script type="text/javascript" src="./justgage.js"></script>
<!-- Raphael JS will be autoloaded -->
Next, initialize the view:
webix.ui({
    view:"justgage-chart",
    value:25,
    title:"Positive",
    height:300,
    min: 0,
    max: 100
});
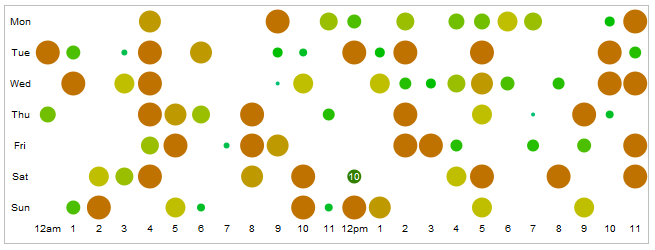
Raphaël Charts
Raphaël JS library offers visualization tools that help to work with vector graphics on the web.
For instance, the dot chart shows data as circles placed on the coordinate system.
Component Initialization
First, you should include the Raphaël JS file from the package into your document in addition to the Webix files:
<script type="text/javascript" src="./raphael.js"></script>Next, initialize the view:
webix.ui({
    view:"raphael-chart",
    url:"...",
    ready:function(){/*...*/};
});
- url - specifies the data source for the chart (data file or script)
- ready - the function that is triggered when the component is fully loaded. It contains the chart source code available on the Raphaël library site.
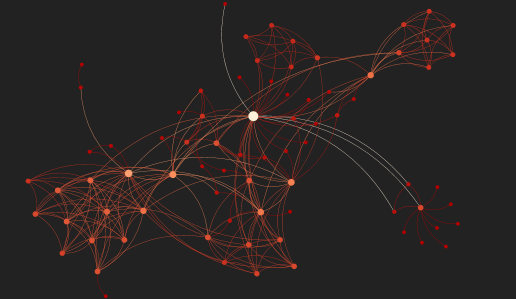
Sigma Charts
Sigma is a JS library that is used to draw graphs using the HTML canvas element. It offers several graph types.
Component Initialization
First, you should include the Sigma JS files from the package into your document in addition to the Webix files:
<script type="text/javascript" src="./sigma.js"></script>Next, initialize the view:
webix.ui({
    view:"sigma-chart",
    url:"./data/les_miserables.gexf"
});
- url property specifies the path to a data file or a script that will generate data.
The look-and-feel of a Sigma chart is defined by the currently used plugin. By default, the Webix-integrated Sigma chart uses the FishEye plugin described in the tutorial on Sigma JS site. At the same time, you can easily change the plugin within the component source code in a private _render_once() function:
_render_once:function(){
    webix.require([
        "sigma/sigma.js", //sigma lib file
        "sigma/plugins/sigma.parseGexf.js", //GEXF extension
        "sigma/plugins/sigma.fisheye.js" //plugin
   ],function(first_init){/* ... */}); //chart initializing
}
In our Github package you will also find the forceAtlas2 Sigma plugin. Besides, you can write your own plugin, place it into the plugin folder and include it into the sigma-chart Webix component in the way described above.
In addition, the support for GEXF data are provided by default.
FusionCharts
FusionCharts is a JavaScript library that provides charting solutions for web and mobile applications.
Related Sample: FusionChart
Component Initialization
First, you should include the FusionCharts files from the package into your document in addition to the Webix files:
<script type="text/javascript" src="./fusion.js"></script>Next, initialize the view:
webix.ui({
    view:"fusion-chart",
    config: {
        // chart config
    }
});
- config - specifies the chart configuration. The available configuration parameters can be found on the FusionCharts site.
Highcharts
Highcharts is an SVG-based multi-platform charting library that makes it easy to add interactive, mobile-optimized charts to web and mobile projects.
Component Initialization
First, you should include the Highcharts file from the package into your document in addition to the Webix files:
<script type="text/javascript" src="./hcharts.js"></script>Next, initialize the view:
webix.ready(function(){
    webix.ui({
        view:"highchart",
        modules:[], // array of desired extra modules
        settings:{
            // chart config
        }
    });
});