series
defines graphs presented on the chart
array series;
Example
webix.ui({
    view:"chart",
    type:"bar",
    ...
    series:[
        {
            value:"#sales#",
            color:"#58dccd"
        },
        {
            value:"#sales2#",
            color:"#36abee",
        }
    ]
});
Related samples
Details
The property is used to present multiple graphs on a chart. Graphs are specified in a standard way.
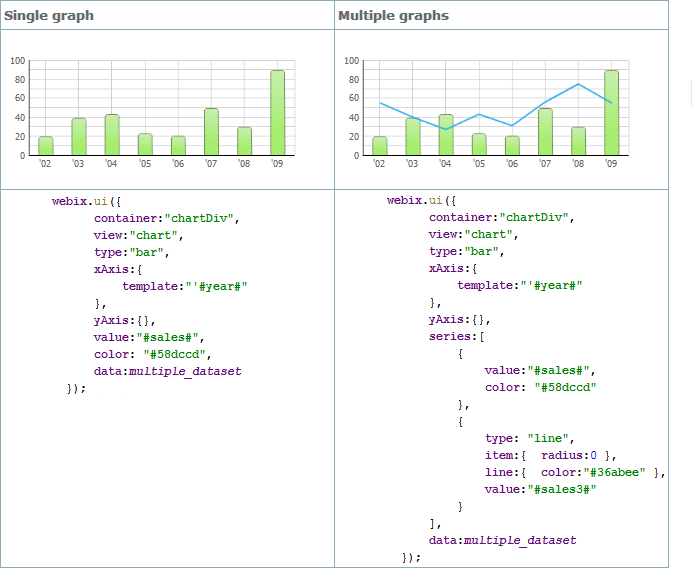
If you add to the chart graphs of the same type, you can omit the type attribute.
See also
API
Articles
If you have not checked yet, be sure to visit site of our main product Webix widget library and page of javascript graph library product.