Gantt User Guide
Gantt is a modern tool for project management. You can add tasks, manage them in the Gantt chart panel using editing, resizing, linking or moving. Read further to dive into the app interface and main controls.
Main Screens
Visually Gantt consists of 3 parts:
- Gantt chart
- Tasks tree
- Information panel.
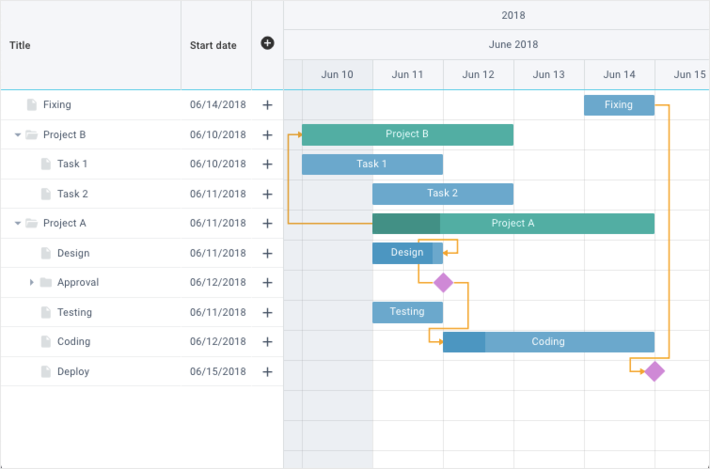
Gantt chart
Gantt chart is the core of Gantt. Here you can look through all the tasks in the various zoom levels (Hour/Day/Week/Month/Quarter/Year) and get the information about their time, duration and progress. Also, you can drag and resize tasks along the horizontal scale as well as establish links between them.
Tasks tree
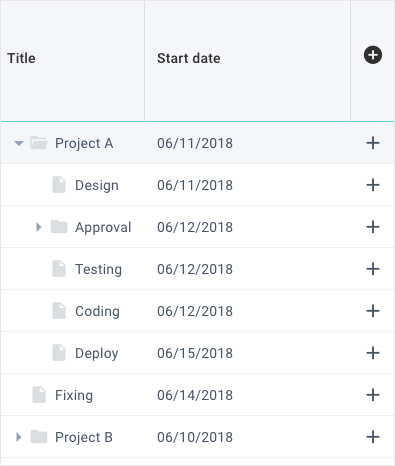
Tasks tree displays the hierarchy of tasks in your project. It is used for quick navigation and contains controls for creating tasks.
Information panel
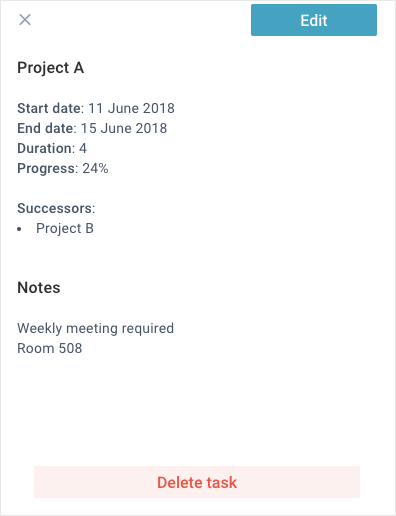
Information panel is designed for previewing, editing and deleting tasks. It can be shown by:
- clicking on any task in the Tasks tree or Gantt chart panel
- clicking on the "+" icon in the Tasks tree panel
Types of Tasks
There are 4 types of tasks in Gantt chart:
- Task
- Milestone
- Project
- Split.
Task
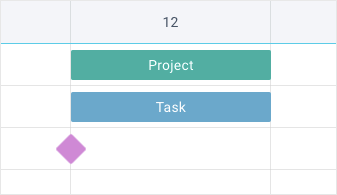
Task is a common task. It has a rectangular shape and a blue color and is usually included into some project.
Milestone
Milestone is a diamond-shaped pink marker that defines an important point in the workflow. Milestones do not have duration or progress, so you can only specify the start date for them.
Project
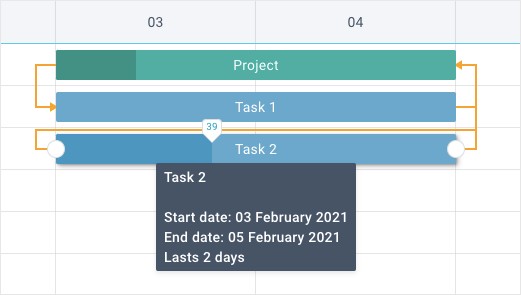
Project is a group of tasks, milestones and other projects. It is marked green.
Project start date is adjusted to the start date of its earliest task while its end date is taken from the end date of its latest task. If a start or end date of any child task is changed, start and end date for the project change accordingly. Project duration and progress depend on the tasks included in it, so you can't change these parameters directly.
You can only change the start date of a project (either via form or by drag-n-drop). In this case, all its child tasks move symmetrically.
Compact Mode
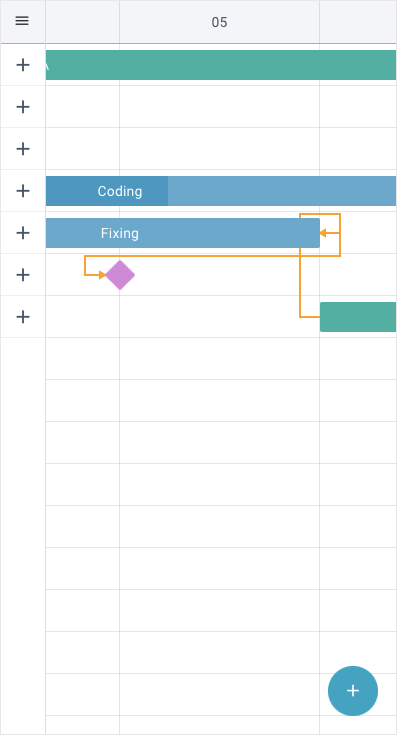
Thanks to the changes in the UI Gantt preserves its functionality:
- you can create upper-level tasks by clicking on the round button with the "+" icon in the bottom right corner
- you can switch between the "Tasks tree and Gantt chart by clicking on the "hamburger" icon in the top left corner
- you can drag or resize tasks by selecting a task with a long touch and moving in the needed direction.
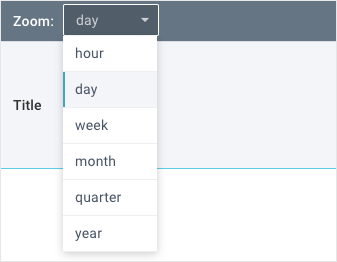
Gantt Scales
Depending on the configuration, you can look through the tasks in the "Gantt chart" by the hour, day, week, month, quarter or year.
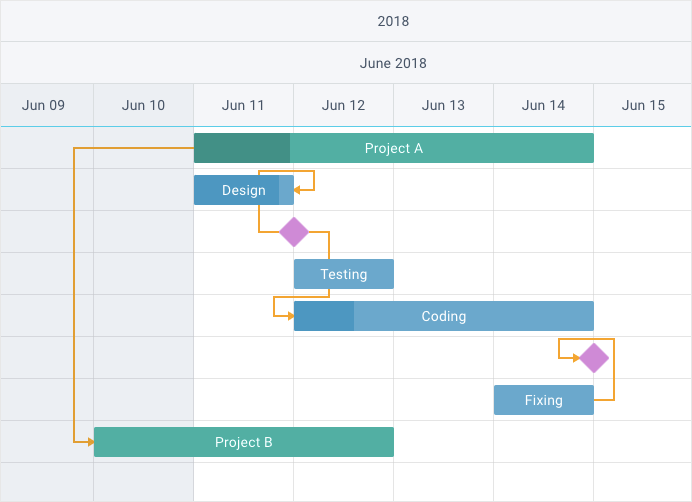
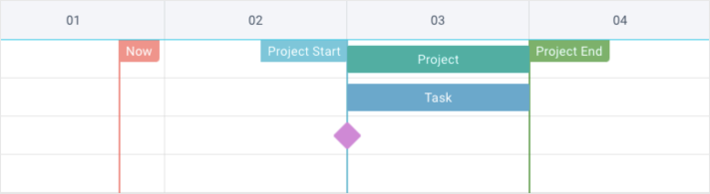
Markers
Depending on the configuration, the current date, start date and end date of the project can be marked with special markers. On the Gantt chart they look like vertical lines with tags at the very top and are highlighted in different colors.
Creating Tasks
For creating a new task, click on the the "+" icon on the Tasks tree panel.
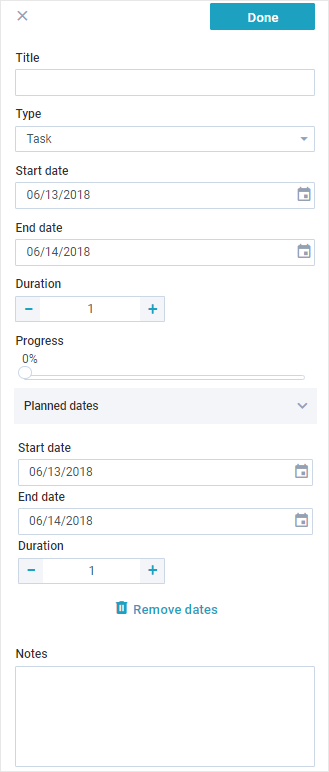
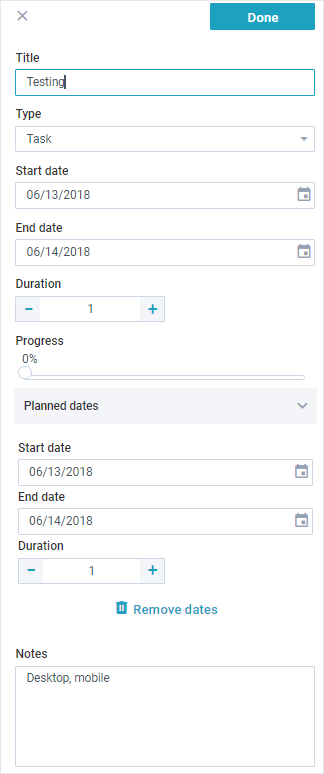
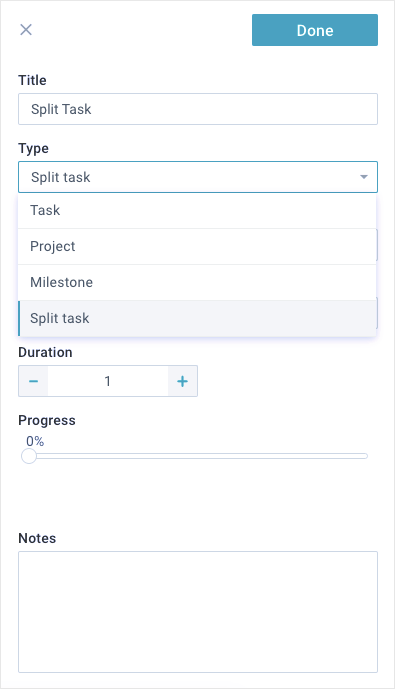
This action will open a form where you can provide information about the task. Here you can specify:
1) Title
2) Type (Task/Project/Milestone/Split)
3) Start date
4) End date
5) Duration
6) Progress
7) Planned dates
8) Notes.
See the picture below:
Editing Tasks
To edit an existing task you should:
1) Click on the desired element in the Tasks tree or Gantt chart panel. It will open the Information panel with the task information
2) Click on the "Edit" button and make necessary changes
3) Click on the "Done" button to save the information and get back to the task information.
The task information will be saved instantly. To close the Information panel click on the "Close" icon.
Drag-n-drop of Tasks
You can change the start date of any task by moving it by the cental part along the horizontal scale.
You can change task start or end date by moving its rightmost and leftmost part (the area is marked with the resizer cursor).
You can also change the task progress by drag-n-drop. Hover any task and move its progress handle into the needed direction.
Deleting Tasks
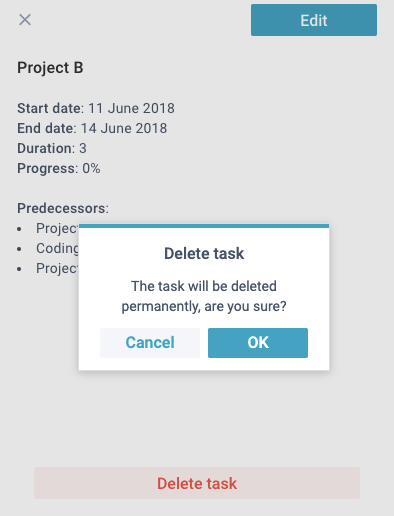
To delete a task you should:
1) Click on the desired task in the Tasks tree or Gantt chart panel. It will open the Information panel with the task information
2) Click the "Delete" button
3) Click the "OK" button in the confirmation popup.
Linking
There are 4 types of links between tasks:
1) End to Start
2) Start to Start
3) End to End
4) Start to End.
You can create links by hovering tasks and connecting round markers at the edges of the tasks.
You can edit and remove the existing links by using the form in the Information panel (see the "Editing tasks" section). In the form, you can find the "Related Tasks" section, where you can see all the links related to your task.
To edit link type, click on the selector opposite the needed link and select a link type from the list.
To remove a link, click on the "trash" icon by the needed link and confirm the action in the pop-up window.
Sorting Tasks
To sort tasks, go to the Tasks tree panel and click on the header of the required column. The system will sort the items in ascending or descending order.
There is a possibility to sort tasks by several columns. To do this, you need to hold down the Ctrl/Command key and sequentially click on the headers of several columns to include them into sorting.
You can also sort the elements of the Tasks tree panel manually. To do this, you need to click on the desired element and drag it to the needed position. If you change the order of elements by dragging them, it will be saved.
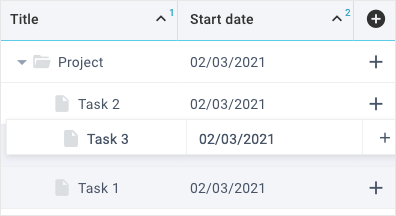
The items sorting in the Tasks tree will immediately reflected in the Gantt Chart.
Critical Path
The Critical path mode is designed to analyze the timing of the project tasks. In this mode you can see the tasks that must be completed in time to meet the project deadline.
The widget analyses the tasks connected with the "End to Start" link. If such tasks overlap or there is no slack between them, the widget will consider them critical and highlight them in red on the Gantt Chart panel.
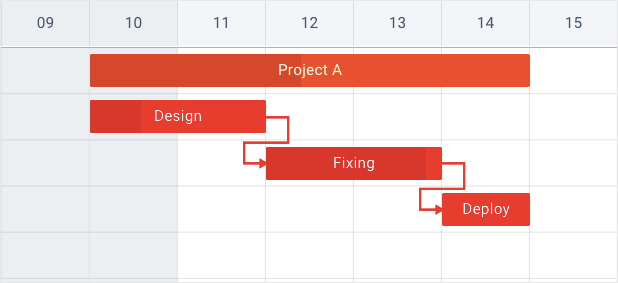
You can show the Critical path on the Gantt Chart with a specific control. Depending on the configuration, it may be a checkbox on the Toolbar panel. You can go to the Critical path mode and back by clicking on the control.
Resources
Gantt can include the support of resources. In this case, you can allocate resources to the tasks and manage their quantity.
Resource interface
In the Tasks tree panel you can see the resources in the separate Assigned column. The assigned resources are displayed opposite each task.
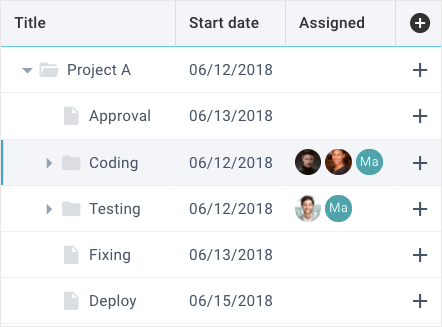
In the Information panel you can look through the list of assigned resources and manage them. To display the Information panel with detailed information about the task and the complete list of assigned resources, click on any task in the Tasks tree panel or Gantt chart panel.
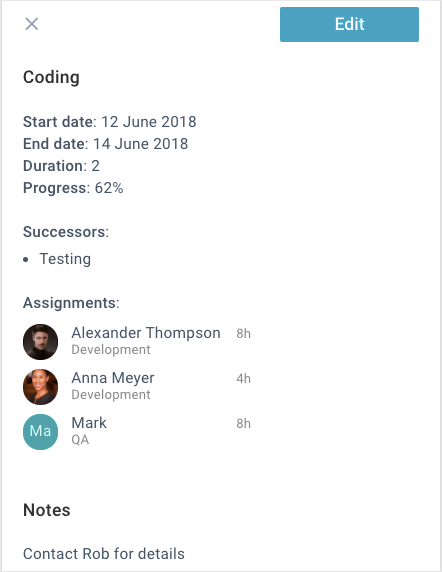
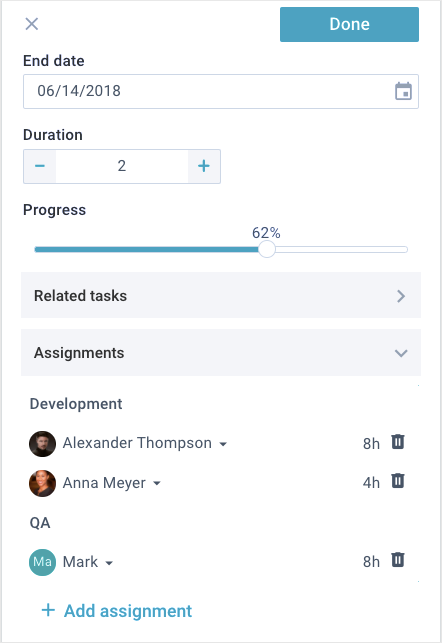
Resource management
To manage resources, click on the "Edit" button in the top right corner of the Information panel. Go to the Assignments parameter and click on it. In the appeared list, you can see all the assigned resources, grouped by categories. Opposite each assigned resource you can see the unit selector and the "Delete" icon. Below the list there is an "Add assignment" button.
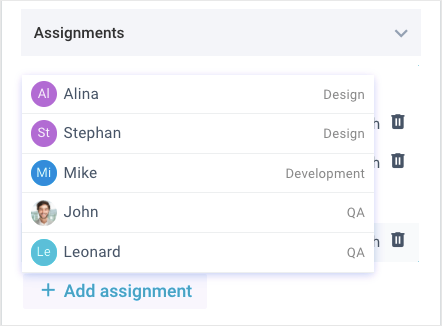
Assigning resources
To add a new assignment, click on the "Add assignment" button. From the dropdown list, select the required resource. The list contains the only resources that are not assigned for this task.
Changing assignments
To change the assignment, click on the required resource. The widget will show a list of resources of the same category, from which you can select an alternative item.
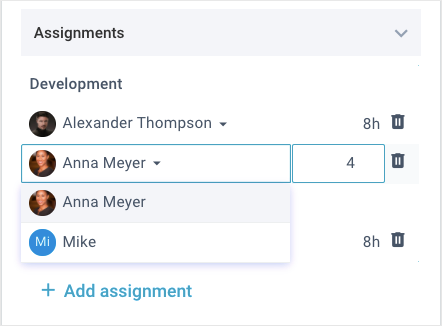
To specify how much of this resource you need, click on the unit selector and specify the required quantity (hours by default).
Deleting assignments
To delete the assignment, click on the "Delete" icon opposite the required resource and confirm the action.
Resources Diagram
The Resources diagram panel is designed to analyze the workload of the project resources. It is displayed at the bottom part of the screen and consists of 3 parts:
- Toolbar
- Resources tree
- Resources diagram.
Toolbar is on the top part of the panel. On the right part of the toolbar there are 2 radio controls for switching between display modes: Hours per day Tasks per day.
Resources tree is on the left part of the panel. There you can see a treetable of all assigned resources grouped by categories. You can sort data by clicking on the header of the corresponding column.
Resources diagram is on the right part of the panel. There you can see the workload of each resource by days.
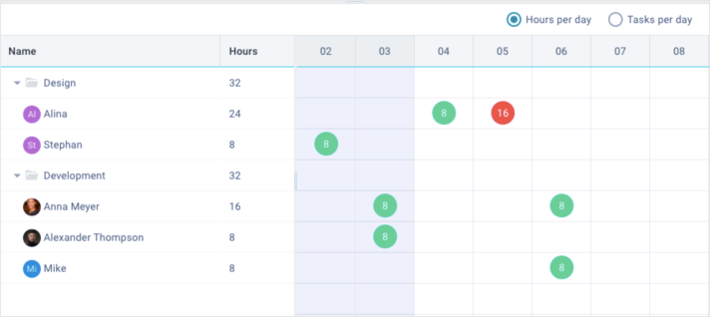
"Hours per day" mode
When you switch to the "Hours per day" mode, the widget will display an extra "Hours" column in the Resources tree. Opposite each resource in this column, you can see the number of the hours assigned to it during the whole project.
Opposite each resource in the Resources diagram, you can see the round markers which indicate resource workload in hours on a particular day. The marker will turn green if the hours do not exceed the allowed value (8 hours by default). Otherwise, the marker will turn red.
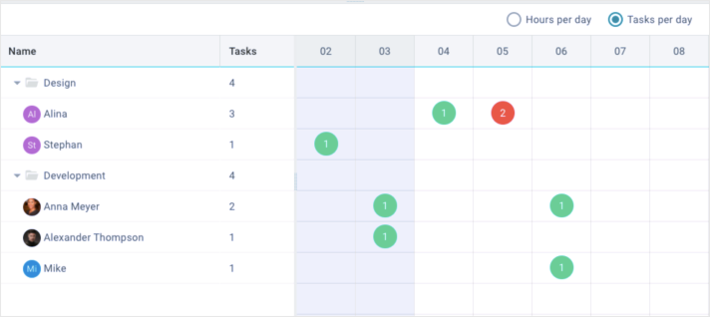
"Tasks per day" mode
When you switch to the "Tasks per day" mode, the widget will display an extra "Tasks" column in the Resources tree.
Opposite each resource in this column, you can see the number of the tasks assigned to it during the whole project.
Opposite each resource in the Resources diagram, you can see the round markers with a number of assigned tasks on a particular day.
The marker will turn green if the hours do not exceed the allowed value (8 hours by default). Otherwise, the marker will turn red.
Displaying
You can show and hide the Resources diagram panel with a specific control. Depending on the configuration, it may be a checkbox on the Toolbar panel. All changes in the Gantt chart panel are immediately reflected in the Resources diagram.
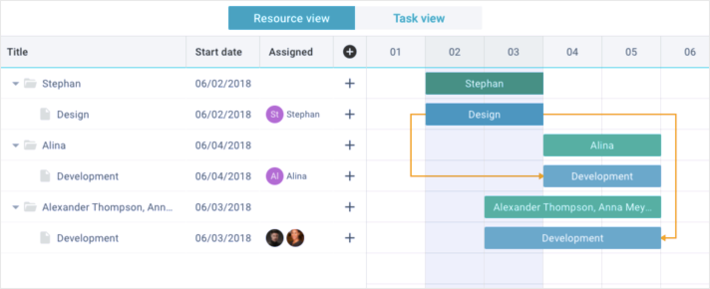
Resources View
The Resources view mode is designed to manage the project resources. Its structure is similar to the Tasks view mode, but there are some differences in its functionality. You can find the differences in the Resources tree and Resources chart.
Resources tree
In the Resources tree you can look through the tasks grouped by resources that are assigned to them, as well as unassigned tasks.
Click on the "+" icon opposite the resource or resource group to create a new task and assign it to this resource (resource group).
Click on the "+" icon in the header of the table to create a new task and place it at the end of the "Unassigned" group. If such a group doesn’t exist yet, then the widget will create it.
You can create, change and delete the task assignments via the edit mode of the Information panel. All changes are immediately reflected in the Resources tree and Resources chart.
You can’t edit the resources because they are generated automatically depending on the assigned tasks.
Resources chart
The Resources chart displays the hierarchy of the Resources tree. The groups have a green color. Below each of the groups there are the blue tasks assigned to it.
You can drag the tasks along the time scale, manage their progress, resize and establish links between them. All changes in the tasks are immediately reflected in their groups.
You can’t edit the groups in such a way because they are generated automatically depending on the assigned tasks.
Displaying
You can switch between display modes with specific controls. Depending on the configuration, it may be buttons on the Toolbar panel.
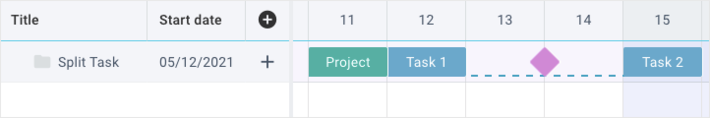
Split Task
Depending on the configuration, the Gantt widget allows you to create split tasks, parts of which are displayed in one row and connected by a dotted line. Unlike regular tasks, the subtasks of the Split task aren't displayed in the Task tree and cannot be expanded.
Creating Split task
You can create a Split task in two ways:
- using drag-n-drop on the Gantt chart
- using edit form on the Information panel.
Creating via drag-n-drop
To create a Split task via drag-n-drop, hold the left mouse button on the empty space in the row of the parent task, move the cursor to the side and release the mouse button.
If the parent task contains nested items, the widget will line them up and add a new subtask.
If the parent task doesn't have any subtasks, the widget will duplicate the parent task and add a subtask.
In the same way, you can create a regular task.
Creating via edit form
Any task with nested subtasks can be split using the edit form. To do this, take the following steps:
1) Click on any task with subtasks in the Task tree or Gantt chart to display the Information panel
2) Click on the "Edit" button to display the edit form
3) Go to the Type selector and select the Split task option
4) Click on the "Done" button to save the result and close the form.
The Split task option is available in the type selector only for tasks with subtasks!
To create a subtask of a Split task, click on the "+" icon opposite the parent task on the Task tree. Enter the required data in the form and save the result.
Back to top