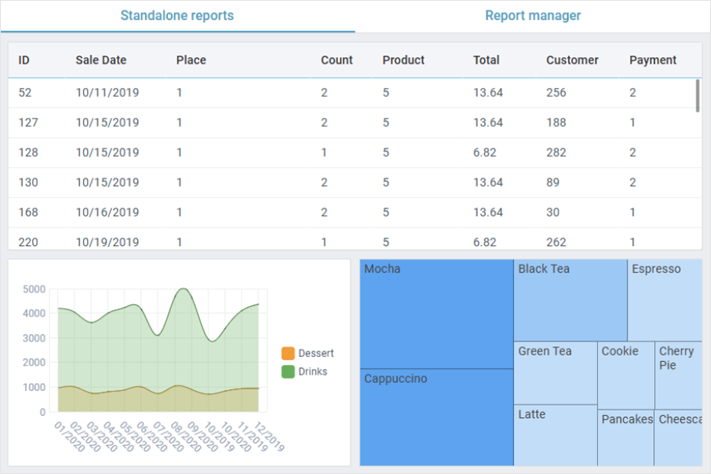
Showing Reports as Standalone Views
You can present reports as standalone views. There are 3 standalone widgets included in the Report Manager source code:
- Table report
- Treemap report
- Chart report
These widgets inherit the API and appearance from DataTable, TreeMap and Chart respectively. However, the current configuration is based on the loaded report.

Related sample: Report Manager: Standalone Reports
Views configuration and data loading
The views have a common configuration:
rows: [
   {
      view: "report-table",
      report: table_report_config,
      reportUrl: "https://docs.webix.com/reports-backend/",
   },
   {
      view: "report-chart",
      report: chart_report_config,
      reportUrl: "https://docs.webix.com/reports-backend/",
   },
   {
      view: "report-treemap",
      report: treemap_report_config,
      reportUrl: "https://docs.webix.com/reports-backend/",
   }
]
The configuration object of each view includes the following properties:
- view - the view name: "report-table", "report-chart", "report-treemap"
- report - a JSON object with report configuration
The report configuration (JSON) matches the report structure provided for the modules of Report Manager. For example:
{
    "desc":"Created on 10/28/2020",
    "data":"companies",
    "joins":[ /*...*/ ],
    "query":"",
    "columns":[
        {
            "id":"companies.region_id",
            "name":"Region",
            /*...*/
        }
    ],
    "group":{
        "by":[ { "id":"companies.region_id" } ],
        "columns":[ /*...*/ ]
    },
    "meta":{ "freeze":1 },
    "sort":null,
    "type":"table"
}
- reportUrl - a string URL for requesting report
The resulting request URL is similar to the default getData() method of Report Manager.
/api/objects/api/objects/sales/data
Where "sales" is the name of the primary dataset for the report. The Form data of the request will include the report configuration. For example:
Request
POST http://localhost:3000/api/objects/api/objects/sales/data
Form data
query: {"glue":"and","rules":[{"field":"companies.name","type":"text", ...}]}
columns: ["companies.name","sum.products.price",...]
joins: [{"sid":"sales","tid":"products",...]
limit:
group: ["companies.name","year.sales.when"]
Response
The server returns the report data. For example:
[
  {
    "companies.name":"Beatty Group",
    "sum.products.price":"199884",
    "year.sales.when":"1900"
  },
  {
    "companies.name":"Beatty Group",
    "sum.products.price":"133256",
    "year.sales.when":"1901"
  },
  // other objects
]