Available only in PRO Edition
Datatable Rowspans and Colspans
Webix Pro only.
Datatable API allows setting rowspans and colspans with the help of the span configuration that is passed together with the datatable data.
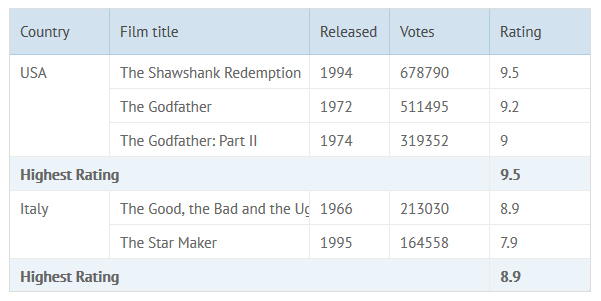
To enable the rowspans and colspans functionality, you should add spans:true to the datatable configuration.
The data you want to display in the datatable is passed in the data object that contains:
- data/url - a data collection that should be loaded;
- spans - an array of rowspans and colspans for the datatable.
webix.ui({
    view:"datatable",
    columns:[...],
    spans:true,
    data:{
        data:[
            { id:1, title:"The Shawshank Redemption", country: "USA", year:1994,
                votes:678790, rating:9.5, rank:1},
            { id:2, title:"The Godfather", country: "USA", year:1972, votes:511495,
                rating:9.2, rank:2},
            { id:3, title:"The Godfather: Part II", country: "USA", year:1974,
                votes:319352, rating:9.0, rank:3},
            ...
        ],
        spans:[
            //span for 3 rows
            [1, "country", 1, 3],
            //span for 4 columns, styled
            ["sub1", "country", 4, 1, null, "highlight"],
        ]

    }
});
Related sample: Colspans in DataTable
Each definition of a rowspan or colspan includes:
- row ID - the id of the first row in colspan/rowspan;
- column ID - the id of the column that starts colspan/rowspan;
- width - how many columns should the span include. 1 by default;
- height - how many rows should the span include. 1 by default;
- value (optional) - the value that the span area should display. If the value of the start cell is required, omit this field or pass an empty value ("", null);
- css (optional) - CSS class that should be applied to the span area.
Besides setting an array of rowspans and colspans directly in the datatable configuration, you can use the addSpan method to add spans into the datatable. It takes the same parameters that were described above, e.g.:
grid.addSpan(1, "country", 1, 3);
You can also remove unnecessary spans with the help of the removeSpan method:
grid.removeSpan(1, "country");
The method takes 2 parameters:
- id - (string/number) the row ID that starts a colspan/rowspan
- column - (string) the column ID that starts a colspan/rowspan
Don't forget to call the refresh method after addSpan or removeSpan in order to re-render the datatable with the applied changes:
grid.refresh();
You can also get the span configuration array with the help of the getSpan method.
var span = grid.getSpan();
CSS for Rowspan and Colspans
The simplest way to add styling to the rowspan or colspan is to mention its css class in the configuration (as shown above).
Extra rules for span elements should be applied to properly position long texts in a row span:
Span CSS
/* ensuring proper display */
.webix_span_layer{
    background: transparent;
    position:absolute;
    left:0px;
    top:0px;
    height:0px;
    width:0px;
    overflow: visible;
}
.webix_dtable_span{
    position:absolute;
    background: #fff;
    white-space: normal;
}
/* coloring */
.hrow{
    background: #DFF;
}
Datatable configuration:
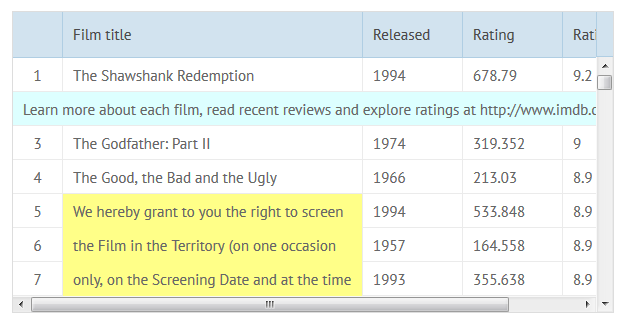
Styled Spans
var text2 = "Learn more about each film, read recent reviews and explore ratings...";

webix.ui({
    view:"datatable",
    columns:[...],
    spans:true,
    data:{
        data:grid_data,
        spans:[
            //span for 6 columns
            [ "2", "rank", 6, 1, text2, "hrow"]
        ]
    }
});
Related sample: Colspans in a Big DataTable
Export to Excel
You can export a datatable with spans and styles into an Excel file. For this purpose, you need to use the toExcel method and pass an object with spans:true and styles:true options as the second parameter:
webix.toExcel("table", {
    spans:true,
    styles:true
});
Related sample: Export to Excel: Styles and Spans
Back to topIf you have not checked yet, be sure to visit site of our main product Webix javascript component library and page of web datagrid product.